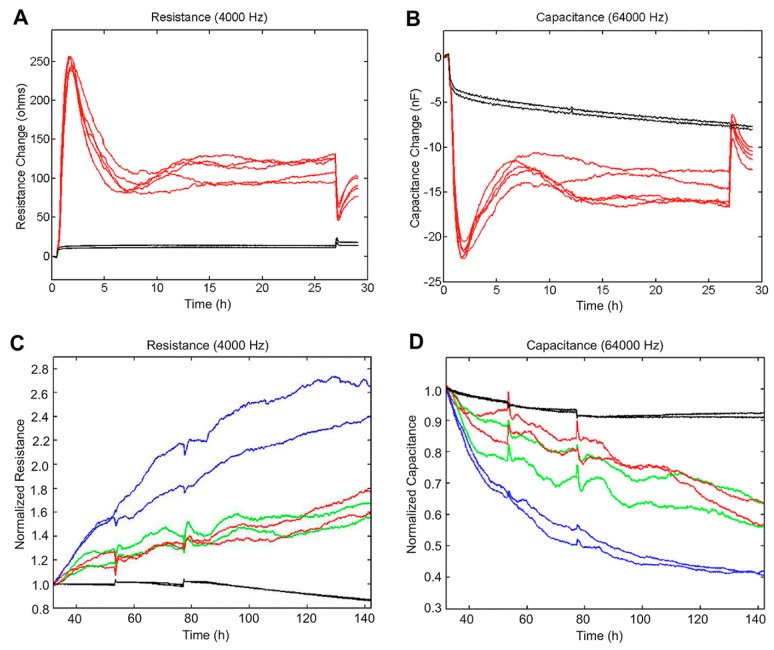
Figure 7.
ECIS measurements with HTPCs and effects of treatment with Dex (A,B). Characterization of HTPC growth after seeding of HTPCs onto ECIS electrodes (0 h). Barrier resistance representing the tightness of cell-to-cell contacts, was measured at 4000 Hz, after preliminary experiments to optimize resistance measurements (A) and capacitance at 64,000 Hz (B). Black lines correspond to the cell-free controls. After 27 h, 1 µM Dex was added. EtOH-treated and untreated cells served as controls. (C) Resistance at 4000 Hz after application of Dex compared to control cells normalized at t = 32 h. Red curves correspond to the untreated control cells, green curves to EtOH-control cells, and blue curves to Dex-treated cells. (D) Capacitance at 64,000 Hz in Dex-treated and control HTPCs normalized at t = 32 h. The black lines in panels C–D correspond to the cell-free controls. In parallel experiments performed with a second HTPC line, similar results were obtained.

