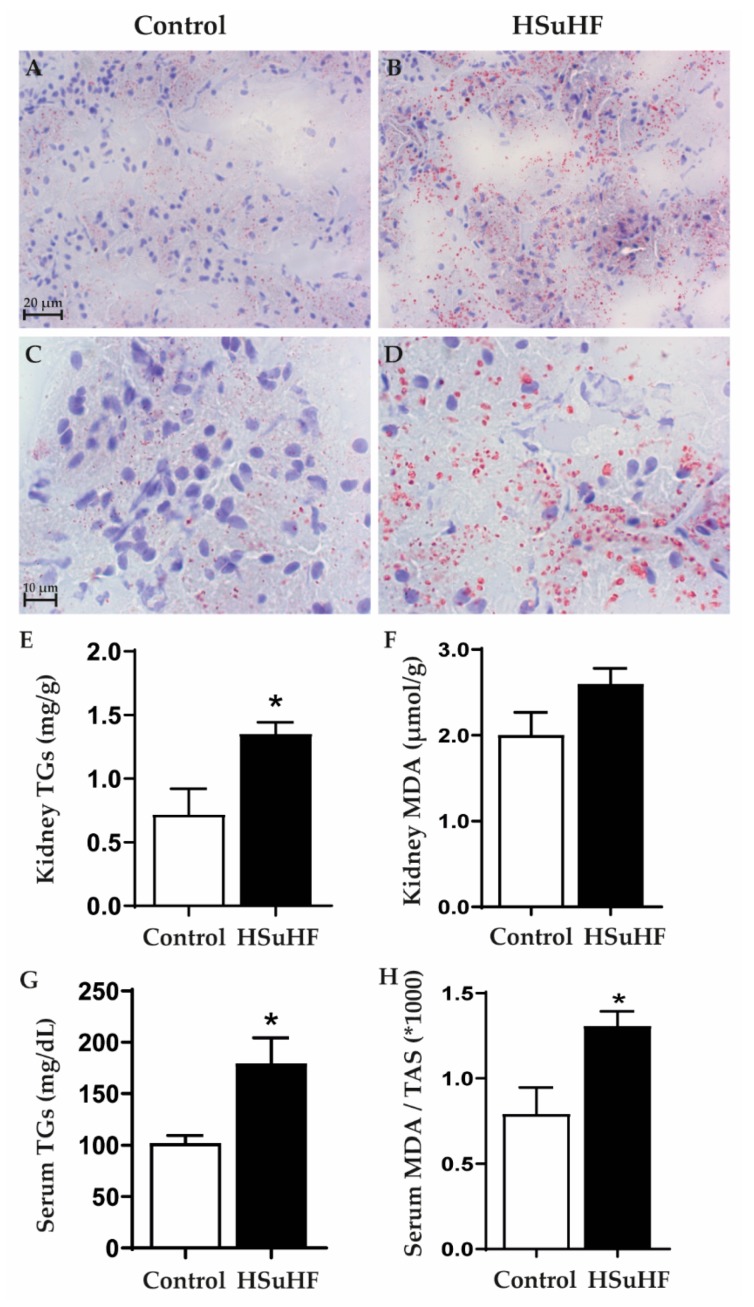
Figure 5.
Renal lipid deposition evaluated by Oil-Red O staining in the Control (A,B) and HSuHF-treated (C,D) rats; kidney TGs concentration (E) and MDA content (F); serum TGs concentration (G) and MDA/TAS ratio (H). Values are means ± S.E.M. of n = 8 per group. * P < 0.05. A and C are 40× amplification and B and D 100×.

