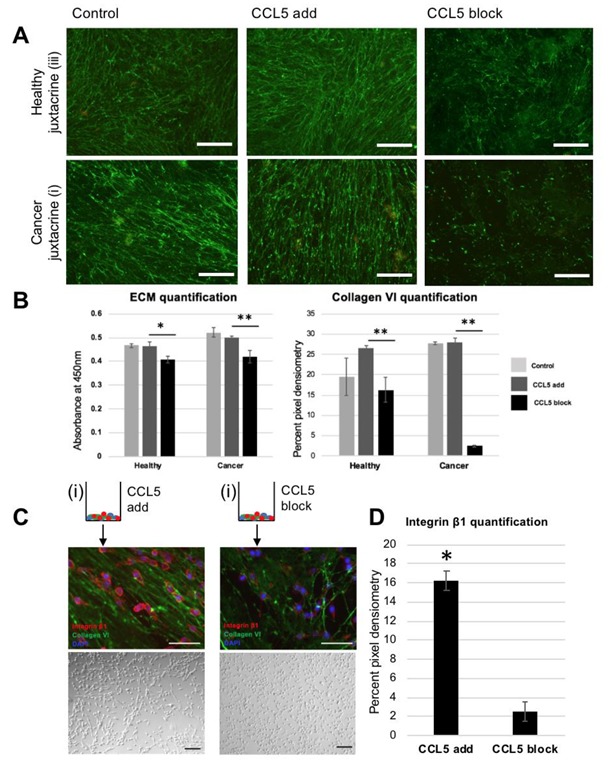
Figure 4.

Blocking CCL5 pathway in vitro reduces both linear ultrastructure of ECM and oncogenic cell response of reseeded cells: (A) fluorescent images of collagen VI immunohistochemistry. Top row is staining of healthy juxtacrine (group (iii)), bottom row is staining of cancer juxtacrine (i). Left hand side shows control group staining (no dose), middle images show staining of ECM deposited while supplied with recombinant CCL5, and right-hand side shows staining of ECM deposited while supplied with monoclonal antibody against CCL5. Scale bar 100 μm. (B) Left: ECM quantification of matrices shown in (A). Right: quantification of pixel density within images in (A). (* p <0.05, ** p <0.01). Color legend: Light gray = control, middle grey = CCL5 added, black = CCL5 blocked. (C) Schematic of two treatment groups. Left side is cancer juxtacrine matrix (group (i)) schematic (with recombinant CCL5 added while matrix was being deposited), showing via immunohistochemistry reseeded MDA-MB-231 on decellularized matrix. Below is a Brightfield image of the same cells. Right side shows the cancer juxtacrine matrix (group (i)) schematic (with monoclonal antibody against CCL5 added while matrix was being deposited), showing via immunohistochemistry reseeded MDA-MB-231 on decellularized matrix. (D) Quantification of integrin β1 pixel density in micrographs of (C). (* p <0.05). Schematic of cancer juxtacrine group represents the cell combination forming the border analogue. Zoomed in panel shows via SEM the linearized matrix, which is found at the tumor boundary, and was produced under high levels of CCL5.
