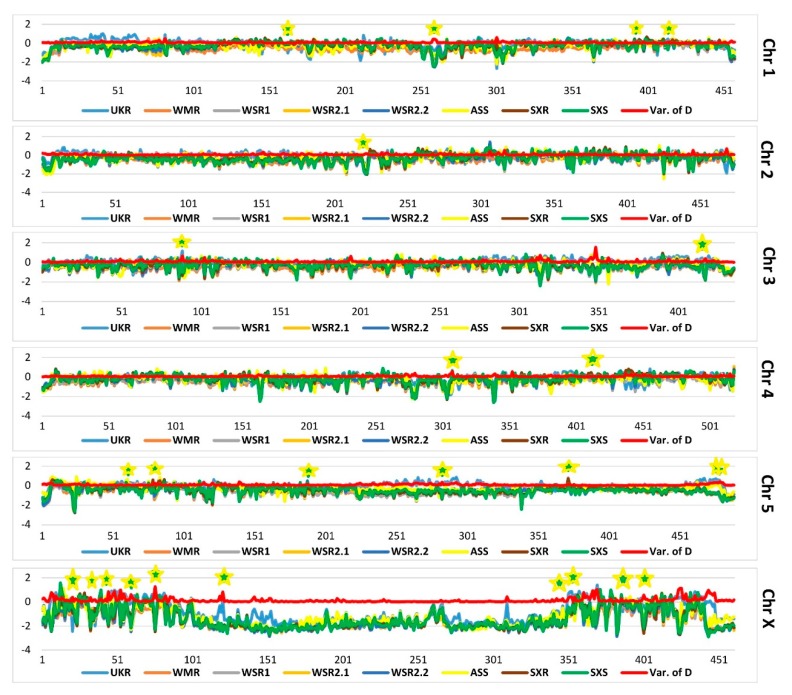
Figure 5.
Genome-wide comparison of Tajima’s D across all the strains in the present study. Tajima’s D was calculated in 100 kb windows spanning the genome, and data was mapped chromosome wise. To emphasize the fluctuation in the allelic frequencies across the chromosomes, the variance in the mean value of Tajima’s D was calculated across the pooled data of all the populations, and mapped along with the respective chromosomal data (red line). A high variance is expected in the regions that are under the selection.

