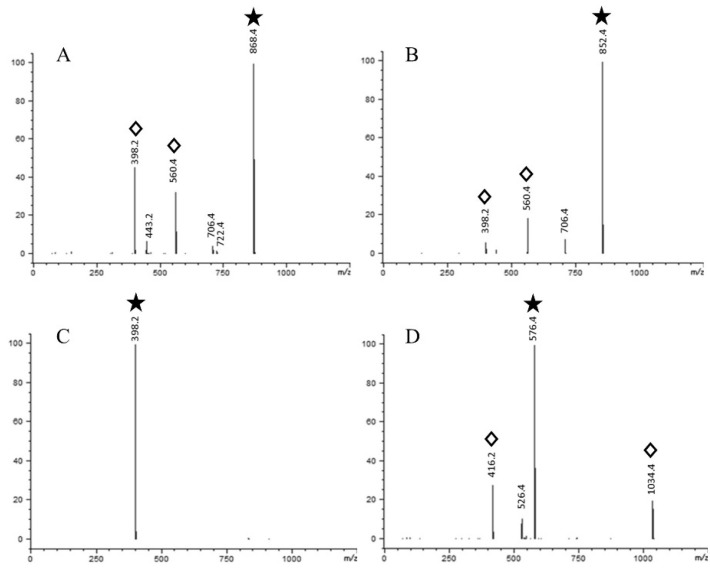
Figure 2.
Mass spectrometric spectra of the standard solutions of α-solanine (A), α-chaconine (B), solanidine (C), and tomatine (D) at 10 µg mL−1 in scan mode. Fragment masses are shown above peaks. Diamonds above masses are ions used for target ( ) and qualifier ions in single ion monitoring mode (
 ).
).

