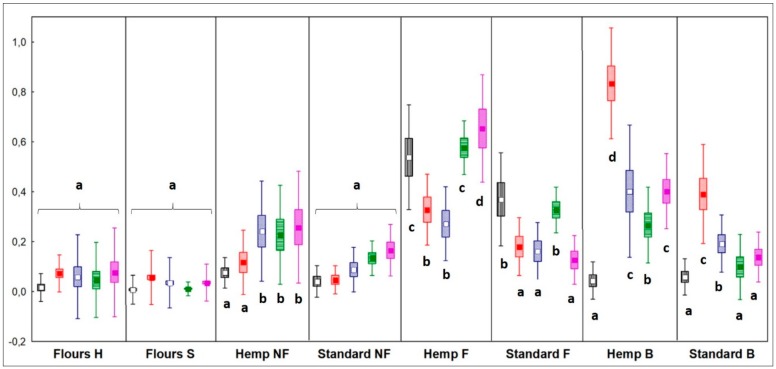
Figure 1.
Relative quantification of total volatile organic compounds (VOCs) divided by chemical classes. Different letters indicate different significance values by Tukey’s HSD test (p < 0.05). Sample abbreviations: H = hemp seed enriched; S = standard; NF = not fermented; F = fermented; B = breads. Box = mean value; Rectangles = mean ± Standard Deviation (SD); Whiskers = mean + 1.96*SD. Black plots = alcohols; red plots = aldehydes; blue plots = ketones; green plots = organic acids; fuchsia plot = alkenes.

