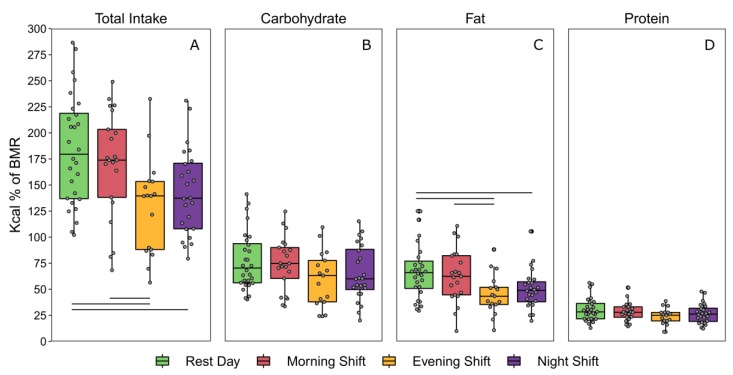
Figure 2.
Total and macronutrient caloric intake across each day type (adjusted for 24-h days) expressed as percentages of basal metabolic rate (% BMR). Boxplots depict the median and interquartile ranges of total % BMR from (A) all calories, (B) carbohydrates, (C) fats, and (D) proteins. Horizontal lines represent significant differences (adjusted, p < 0.05) between day types relative to metabolic requirements.

