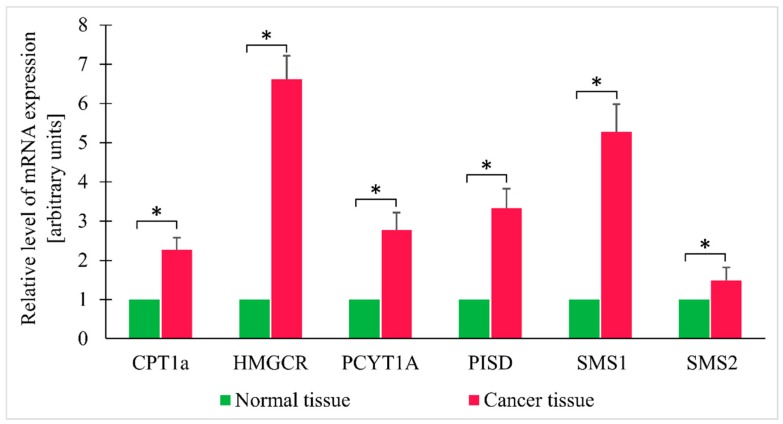
Figure 5.
Relative expression levels of selected genes in normal and colorectal cancer tissue. Values are mean ± SEM; * p < 0.05, n = 25; CPT1a—Carnitine palmitoyltransferase I; HMGCR—HMG-CoA reductase; PCYT1A—choline-phosphate cytidylyltransferase A; PISD—phosphatidylserine decarboxylase; SMS1 - sphingomyelin synthase 1; SMS2; sphingomyelin synthase 2.

