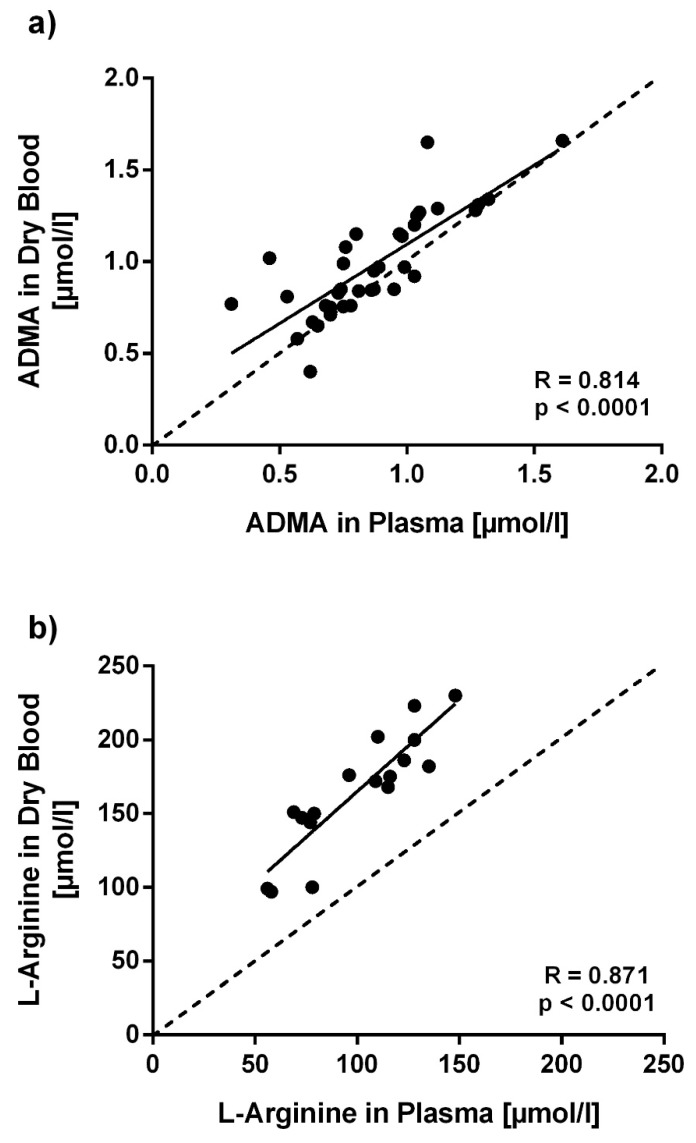
Figure 4.
Correlation of ADMA and L-arginine concentrations measured in dried blood spots and in plasma. ADMA (a) and L-arginine (b) were measured from dried blood spots and plasma samples collected from the same subjects at the same day. Each dot marks one subject’s assay results. The dotted line marks the line of equivalence between both assays. R values represent Pearson’s correlation coefficients.

