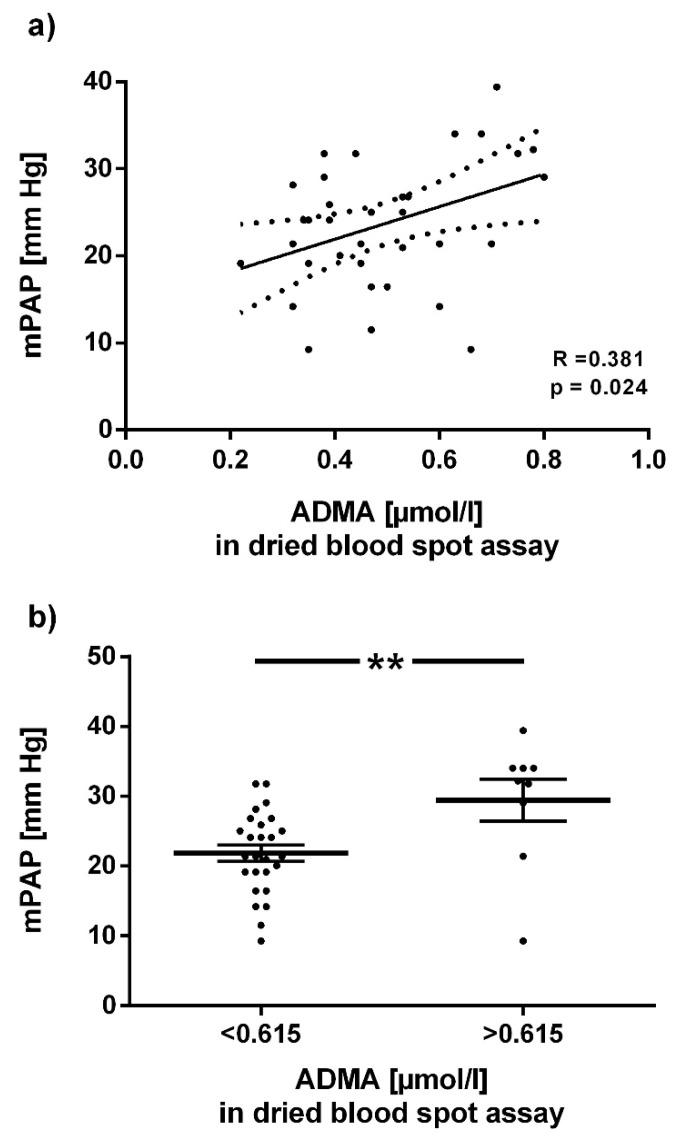
Figure 6.
Association of baseline ADMA concentration in dried blood spots with mean pulmonary arterial pressure after 6 months of CIH. (a) Linear regression analysis of dried blood spot ADMA concentration at baseline with mean pulmonary arterial pressure (mPAP) after six months of exposure to chronic intermittent hypoxia (CIH). (b) Mean pulmonary arterial pressure (mPAP) at month 6 of CIH exposure in individuals with baseline dried blood spot ADMA concentration below or above o.615 µmol/L, the optimal cut-off for discrimination of the two groups in ROC analysis. Horizontal lines indicate mean ± SD; each dot represents one individual. ** p < 0.01 between groups.

