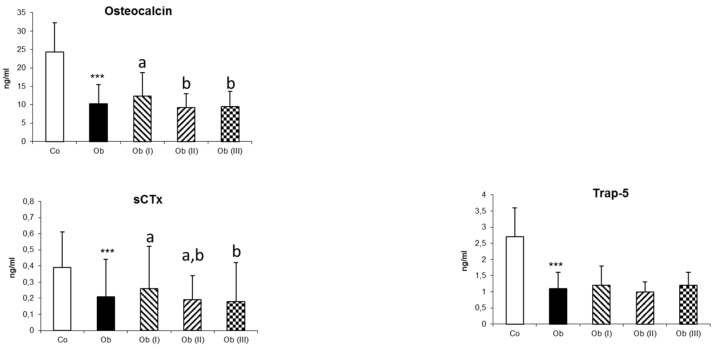
Figure 1.
Markers of bone turnover in controls (CO) and in patients (Ob) according to the class of obesity. Data are presented as mean ± standard deviation. Patients with obesity were classified into three subgroups according to the body mass index (BMI) as follows: Class I obesity (Ob I): patients with BMI 30–34.9 kg/m²; Class II obesity (Ob II): patients with BMI 35–39.9 kg/m²; and Class III obesity (Ob III): patients with BMI ≥ 40 kg/m². *** indicates a significant difference between controls and patients with obesity for p < 0.001. For comparisons between subgroups of patients with obesity according to the BMI, there are no significant differences when two subgroups share the same letter (a or b) or no letter is displayed. sCTx: type I-C telopeptide breakdown product; Trap-5: Tartrate-resistant acid phosphatase-5.

