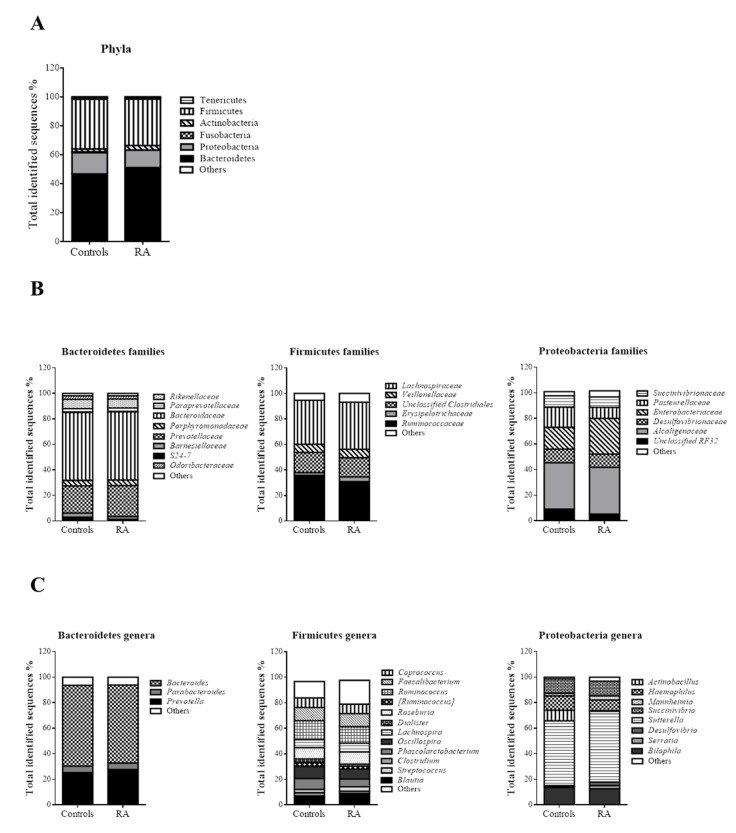
Figure 2.
(A) Phylogeny at phyla in controls and RA patients. (B) Microbial community structure at the family level in fecal samples of controls and RA patients (Bacteroidetes families, Firmicutes families and Proteobacteria families). (C) Relative abundance of predominant genera in the microbiota of controls and RA patients (Bacteroidetes genera, Firmicutes genera and Proteobacteria genera). Data are shown as a percentage of the total identified sequences per group.

