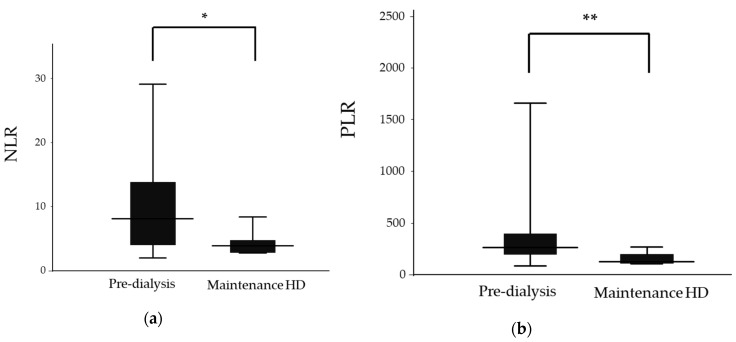
Figure 2.
Neutrophil-to-lymphocyte ratios (NLR) and platelet-to-lymphocyte ratios (PLR) in the pre-dialysis and maintenance hemodialysis (HD) groups. (a) NLR in the pre-dialysis and maintenance HD groups. (b) PLR in the pre-dialysis and maintenance HD groups. The top and the bottom of the boxes are the first and third quartile, respectively. The length of the box represents the interquartile range. The line through the middle of each box represents the median. The error bars show the minimum and maximum values (range). *, p < 0.05; ** p < 0.01. NLR—neutrophil-to-lymphocyte ratio; PLR—platelet-to-lymphocyte ratio; HD—hemodialysis.

