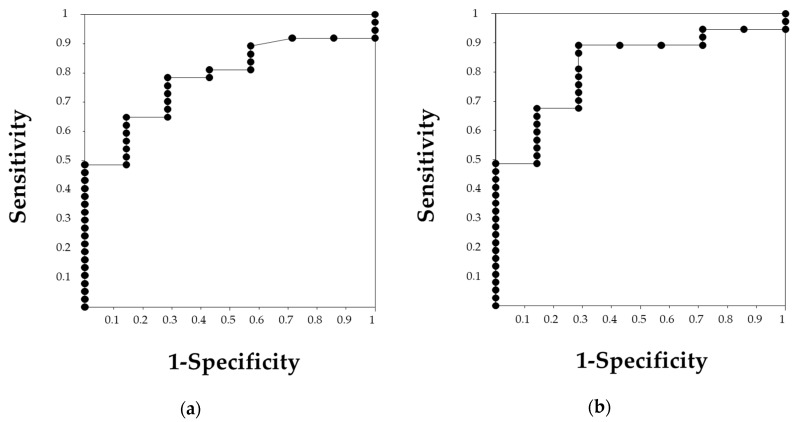
Figure 3.
The receiver operating characteristic (ROC) curve of neutrophil-to-lymphocyte ratio (NLR) and platelet-to-lymphocyte ratio (PLR) for predicting renal outcome. (a) The ROC curve of NLR showing an area under the curve (AUC) of 0.782. An NLR of 4.0 was the cutoff value with a sensitivity of 78.4% and a specificity of 71.4%. (b) The ROC curve of PLR showing an AUC of 0.819. The cutoff value of 137.7 was determined with a sensitivity of 89.2% and a specificity of 71.4%.

