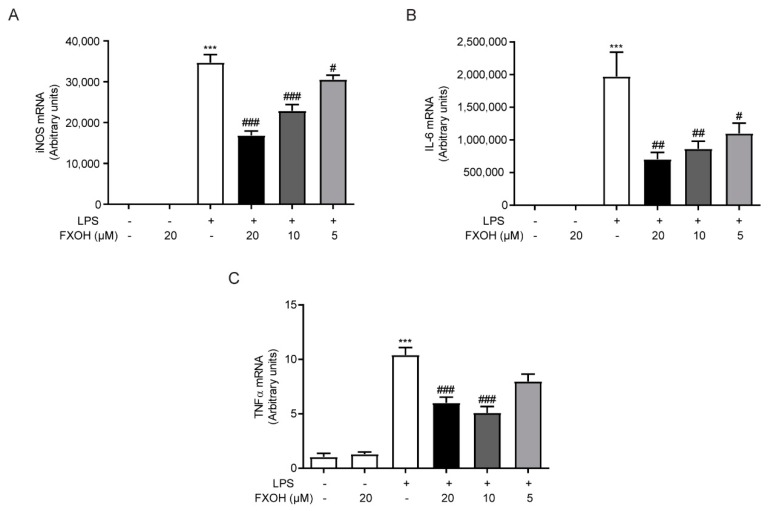
Figure 4.
Effects of FXOH on the mRNA expression of inflammatory cytokines. (A) iNOS, (B) IL-6, and (C) TNF-α mRNA expression levels were determined by real-time PCR. RAW264.7 cells were pre-treated with FXOH (20, 10, and 5 µM) and then stimulated with LPS (100 ng/mL) for 24 h. Data represent the mean ± SEM. *** P < 0.001 compared with the control group, # P < 0.05 compared with the LPS group (received the treatment of LPS and the vehicle of FXOH), ## P < 0.01 compared with the LPS group, ### P < 0.001 compared with the LPS group.

