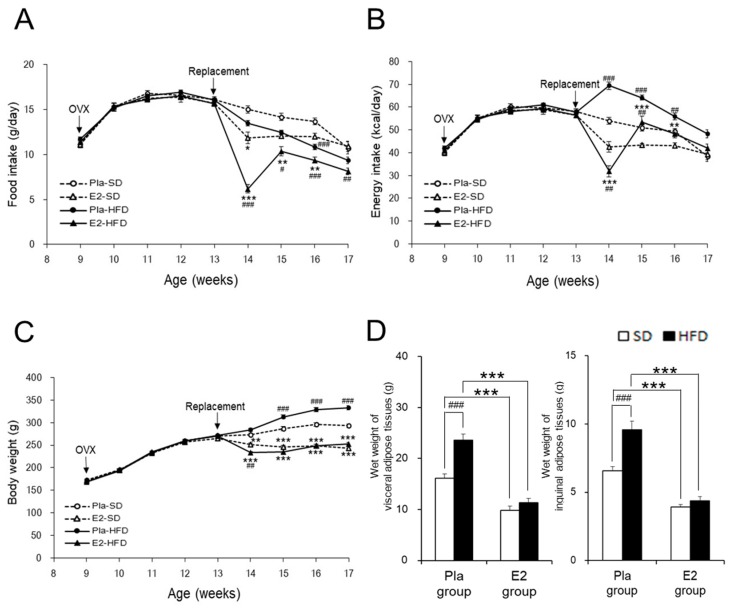
Figure 1.
Characterization of the studied rats. Data are expressed as means ± SE. Line graphs represent the course of change in mean food intake (A), energy intake (B), and body weight (C) in the placebo (Pla)-standard diet (SD) (n = 18), 17β-estradiol (E2)-SD (n = 14), Pla-high-fat diet (HFD) (n = 30), and E2-HFD (n = 26) groups of ovariectomized (OVX) rats. Two-way repeated-measures ANOVA for each pair-wise comparison among the four groups revealed significant differences in food intake, energy intake, and body weight. There was an interaction of age and group effects in food intake (p Age × Group < 0.001: E2–HFD vs. E2–SD or Pla–HFD), energy intake (p Age × Group < 0.001: Pla–HFD vs. Pla–SD or E2–HFD) and body weight (p Age × Group < 0.05: Pla–SD vs. Pla–HFD, p Age × Group < 0.01: Pla–SD vs. E2–SD, and p Age × Group < 0.001: Pla–HFD vs. E2–HFD). * p < 0.05, ** p < 0.01, and *** p < 0.001, differences between the E2 and Pla groups; # p < 0.05, ## p < 0.01, and ### p < 0.001, differences between the SD and HFD groups. Bar graphs represent wet weights of visceral (the sum of the mesenteric, kidney–genital, and retroperitoneal adipose tissue weights) and inguinal adipose tissues (D) at 17 weeks of age in the Pla–SD (n = 18), the Pla–HFD (n = 16), the E2–SD (n = 14), and the E2–HFD (n = 12) groups. Data were analyzed by two-way factorial ANOVA, followed by a post hoc Tukey–Kramer test. There was an interaction of diet and group effects in the wet weights of visceral (p Diet × Group < 0.01) and inguinal adipose tissues (p Diet × Group < 0.01). *** p < 0.001, differences between the E2 and Pla groups; ### p < 0.001, differences between the SD and HFD groups.

