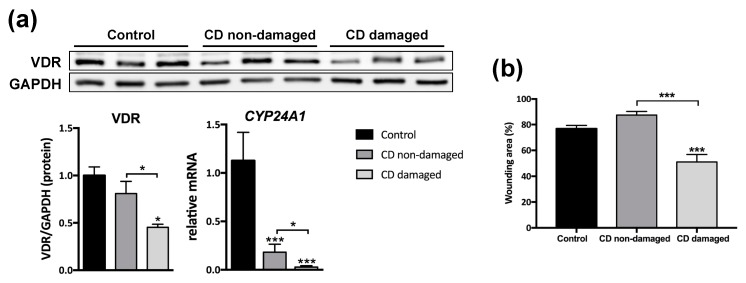
Figure 2.
Reduced VDR expression and a higher migration rate in intestinal fibroblasts of CD patients. (a) A Western blot showing protein levels in fibroblasts isolated from non-damaged tissue of control patients (n = 3) and non-damaged and damaged tissue of CD patients (n = 3). Graphs show protein expression vs. GAPDH or the relative mRNA expression of CYP24A1 gene vs. β-actin in control (n = 4) and CD (n = 7) fibroblasts. In all cases, data are represented as fold induction vs. control fibroblasts. (b) The graph represents percentage of the wounding area (time 0, 100%) at 48 h in fibroblasts from control, CD non-damaged and CD-damaged tissue treated with medium iFBS-free. In all cases, bars in graphs represent mean ± s.e.m., and significant differences vs. the control group or vs. the non-damaged CD (connecting lines) are shown by * p < 0.05 or *** p < 0.001.

