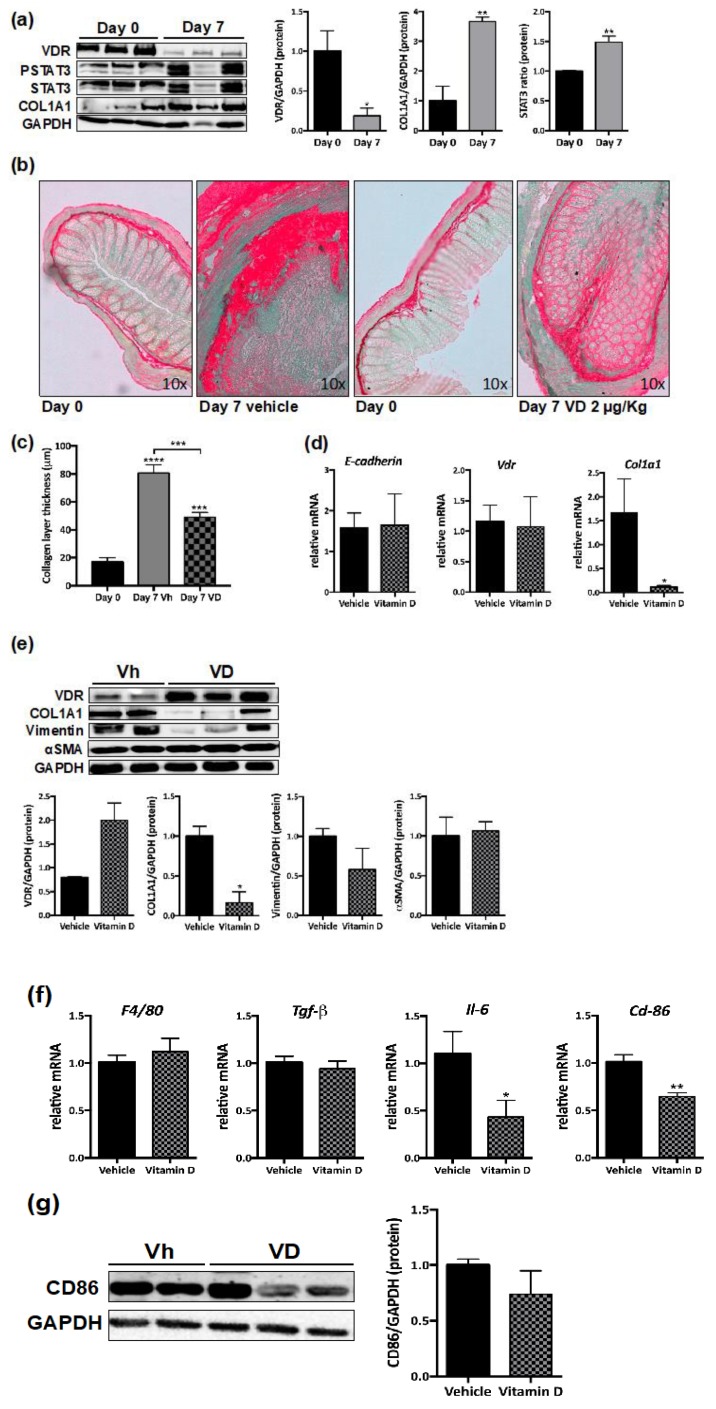
Figure 4.
VD reduces murine intestinal fibrosis. (a) Western blots of protein levels in total lysates from intestinal grafts at day 0 (control) (n = 3) or seven days after transplantation (n = 3). Graphs show protein expression vs. GAPDH represented as fold induction vs. day 0. Bars in graph represent mean ± s.e.m., and significant differences vs. day 0 are shown by * p < 0.05 or ** p < 0.01 (b) Sirius Red staining was performed in paraffin-embedded intestinal tissue at day 0 and in intestinal explants. Representative pictures taken under transmission light. (c) Graph shows the collagen layer thickness quantified in intestine and grafts by Image J. Significant differences vs. day 0 or vs. 7 days-vehicle (connecting lines) are shown by *** p < 0.001. (d) Graphs show the relative mRNA expression (expressed as fold induction vs. vehicle-treated group) of different genes vs. β-actin in intestinal explants from mice treated for 7 days with VD 2 μg/kg (n = 6) or vehicle (n = 6). (e) Western blot images of protein expression from 7 day grafts from mice treated with VD (n = 3) or vehicle (n = 2). Graphs represent protein expression vs. GAPDH quantification expressed as fold induction vs. vehicle-treated group. In (d) and (e), bars in graph represent mean ± s.e.m. and significant differences vs. the vehicle group are shown by * p < 0.05. (f) Graphs show the mRNA expression of different genes vs. β-Actin (expressed as fold induction vs. vehicle) in 7 day grafts from mice treated with VD (n = 6) or vehicle (n = 6). Bars in graph represent mean ± s.e.m., and significant differences vs. the vehicle group are shown by * p < 0.05 or ** p < 0.01. (g) A Western blot showing CD86 protein levels in grafts from vh- or VD-treated mice. The graph represents protein expression vs. GAPDH quantification expressed as fold induction vs. vehicle-treated group.

