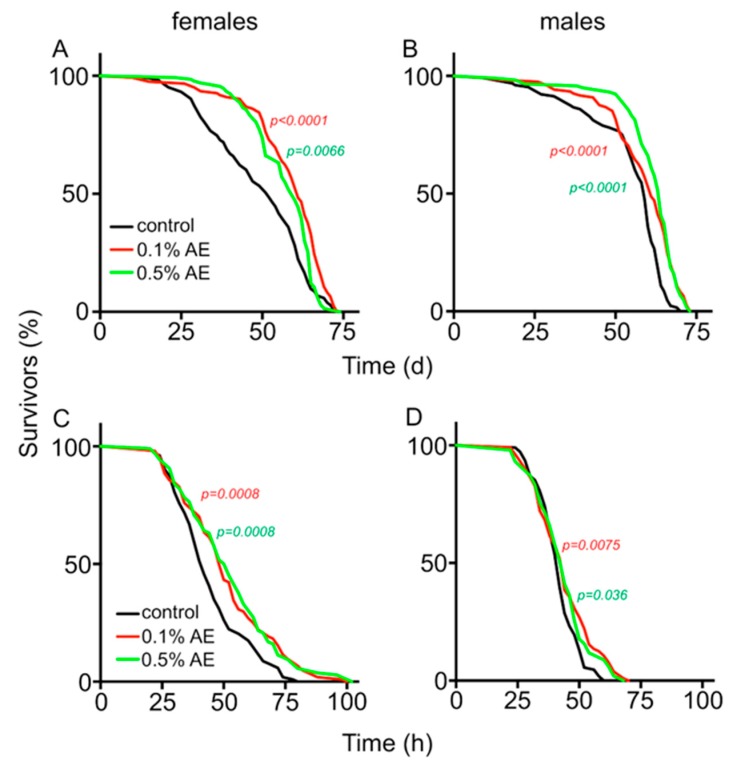
Figure 2.
Lifespan analyses of female (A) and male flies (B), subjected to continuous drought (20% humidity) and normal food (black line), normal food supplemented with 0.1% BAE (red line), or 0.5% BAE (green line), were quantified. Statistical analysis (see Figure 1, n > 100 for each experiment). Starvation resistance of female (C) and male (D) flies that were fed on normal media (black lines) or on normal food supplemented with 0.1% BAE (red lines) or 0.5% BAE (green lines). Statistical analysis (see Figure 1, n > 100 for each experiment).

