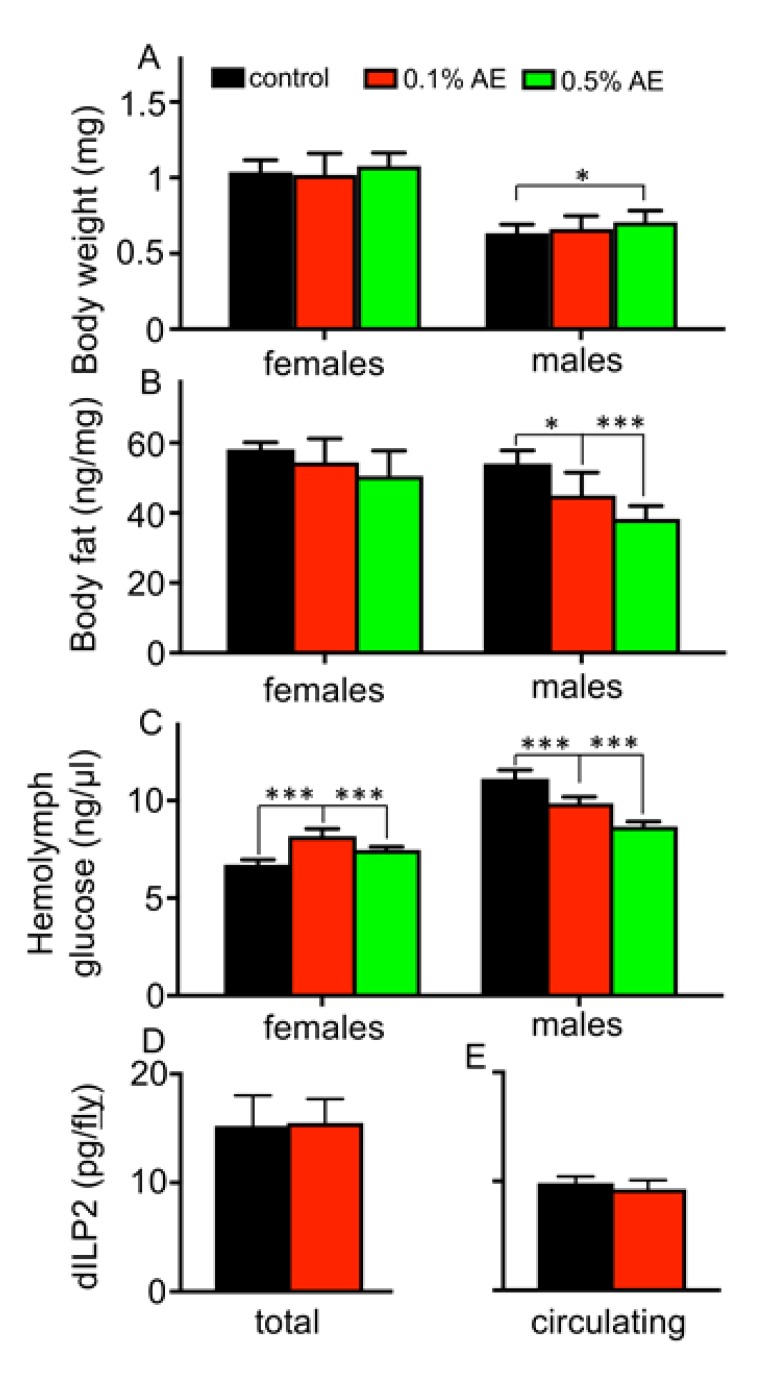
Figure 4.
The body weights (A), the body fat contents (B), and the hemolymph glucose levels (C) of female (left) and male flies (right) hold on control food (black bars) or on normal food supplemented with 0.1% BAE (red bars) or on normal food supplemented with 0.5% BAE (red bars). Total dILP2 levels of female flies after one week on 0.1% BAE (D) and those present in the hemolymph (E) are shown. Mean values ± SD are displayed. n > 5 for each experiment. * p < 0.05, *** p < 0.001.

