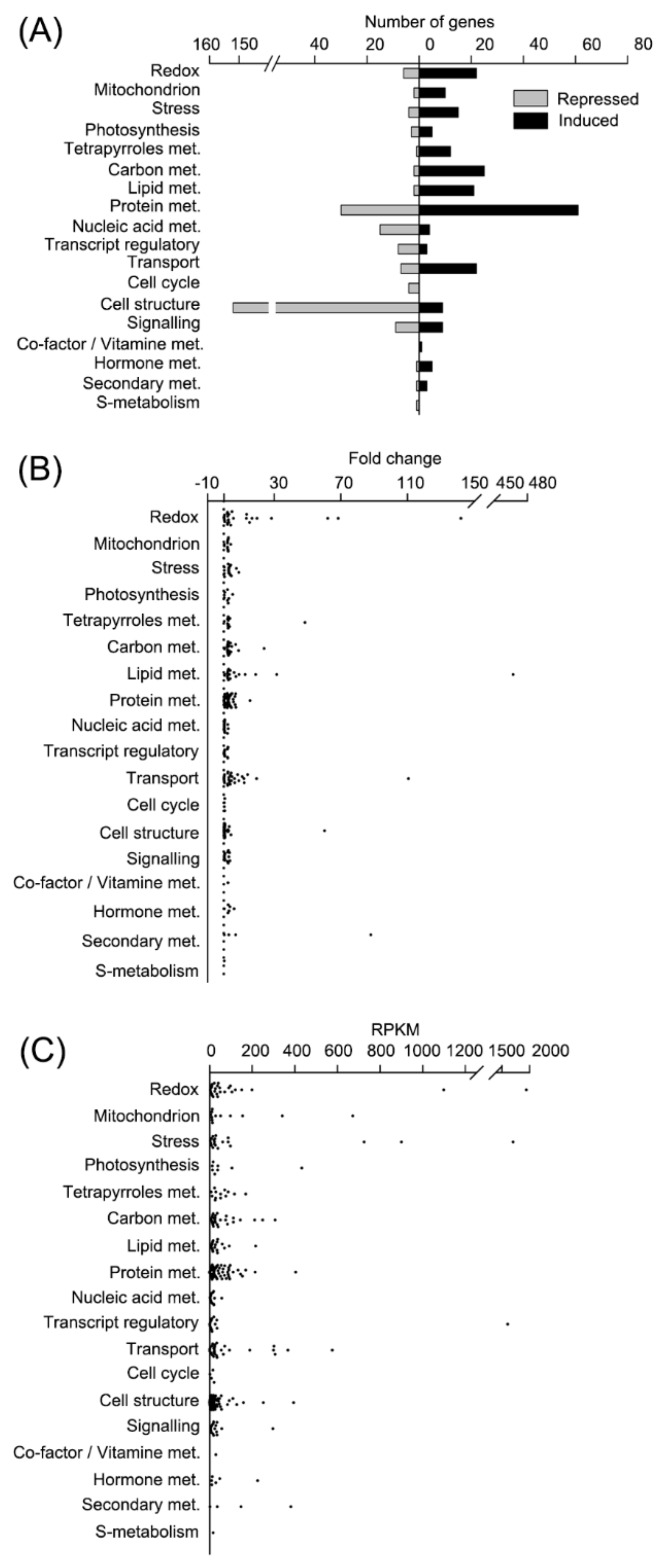
Figure 3.
Functional analysis of differentially expressed genes in CC4348 after being treated with 1 μM RB for 30 min. (A) Functional subcategory of differentially expressed genes (DEGs) in CC4348 treated with 1 μM RB for 30 min. For clarity, only the genes with assigned functions are shown. Functional analysis of DEGs passing the criteria of fold change greater than two (up) or smaller than 0.5 (down) with FDR < 1%, based on the MapMan functional classes; met, metabolism. (B) The fold change of transcript abundance of DEGs in (A). The X-axis indicated the logarithm based two of the ratio of transcript abundance of genes after treated with 1 μM RB for 30 min to control in CC4348. (C) The relative transcript abundance of DEGs in (A). The X-axis indicated the value in unit of RPKM of transcript abundance after treated with 1 μM RB for 30 min in CC4348.

