Figure 5.
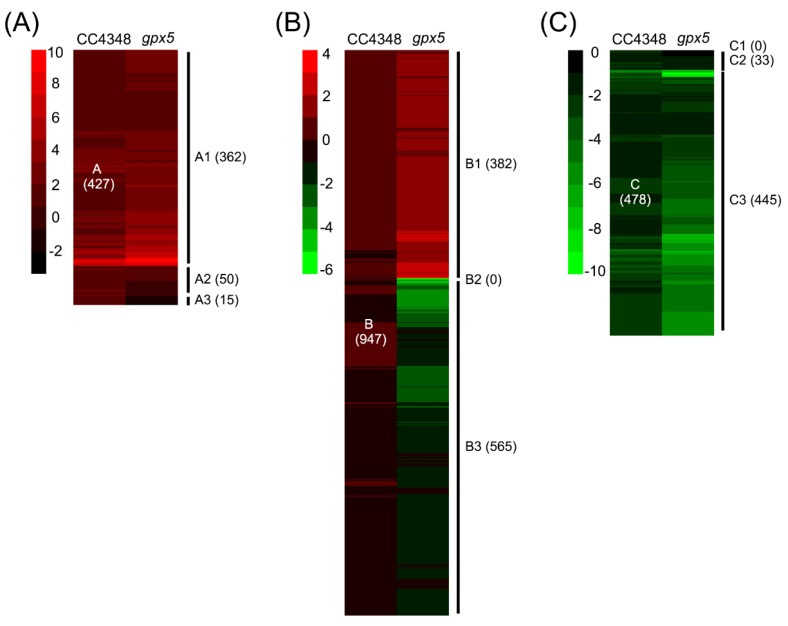
Comparison of the transcriptional response of CC4348 versus the gpx5 mutant after treatment with 1 μM RB for 30 min. The cluster diagrams depict the fold change in transcript levels determined by RNA-seq. The log2 relative expression values of 1 and −1 were selected as thresholds to designate the categories of transcripts that accumulated and declined, respectively. (A) The upregulated DEGs in CC4348 were categorized into A1 (upregulated in the gpx5 mutant), A2 (no significant change in the gpx5 mutant), and A3 (down regulated in the gpx5 mutant). (B) The genes without significant changes in CC4348 but with significant changes in the gpx5 mutant were categorized into B1 (upregulated in the gpx5 mutant), B2 (no significant change in the gpx5 mutant), and B3 (downregulated in the gpx5 mutant). (C) The downregulated DEGs in CC4348 were categorized into C1 (upregulated in the gpx5 mutant), C2 (no significant change in the gpx5 mutant), and C3 (downregulated in the gpx5 mutant).

