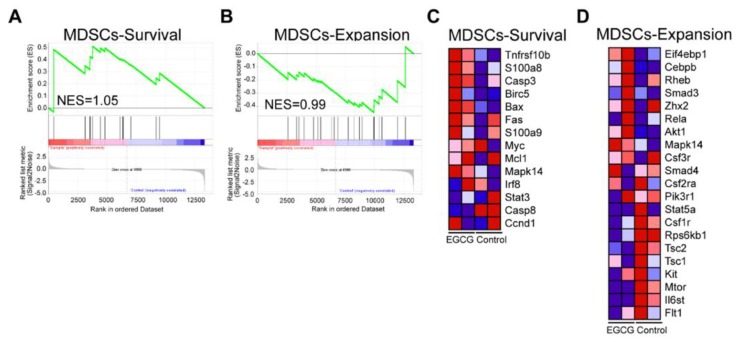
Figure 5.
Gene set enrichment analysis (GSEA) results of MDSC survival and expansion gene sets after treatment of EGCG based on RNA-seq data. MDSC survival (A) and MDSC expansion gene sets (B) were enriched after 6 h-EGCG treatment. A heatmap of the key genes in MDSC survival (C) and MDSC expansion (D) is displayed. Red color indicates high expression and blue color indicates low expression.

