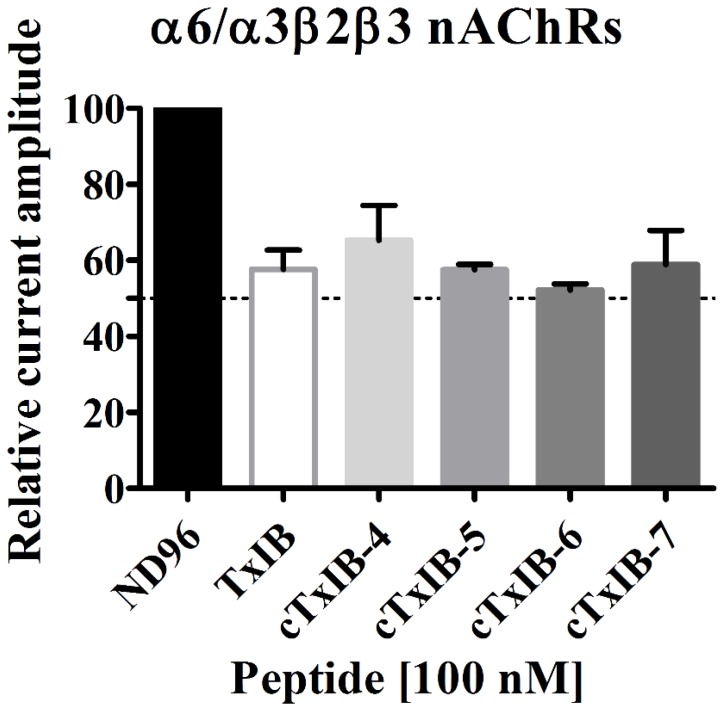
Figure 4.
The relative current amplitude of TxIB and cyclized analogues at a concentration of 100 nM on rat α6/α3β2β3 nAChRs. The ND-96 solution was used as the negative control. Data points are mean ± SEM (n = 3–4). Statistical analysis was according to one-way ANOVA; * p < 0.05, ** p < 0.01, and *** p < 0.001 versus TxIB.

