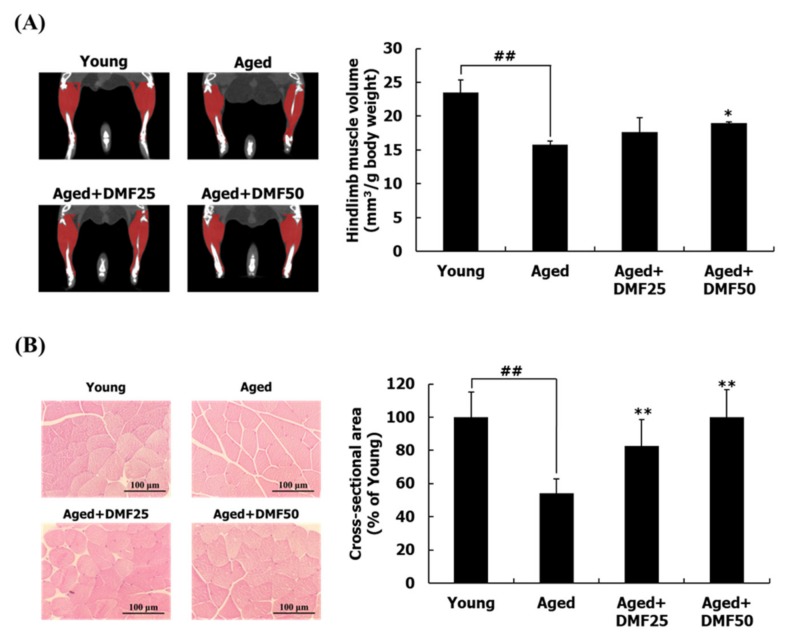
Figure 3.
Effect of DMF on body composition. (A) Hindlimb volume. (B) The cross-sectional area of the gastrocnemius muscle fiber (magnification, ×200). Muscle volume was normalized to the body weight. Results are presented as mean ± SD; ## p < 0.01 vs. Young group; * p < 0.05, ** p < 0.01 vs. Aged group.

