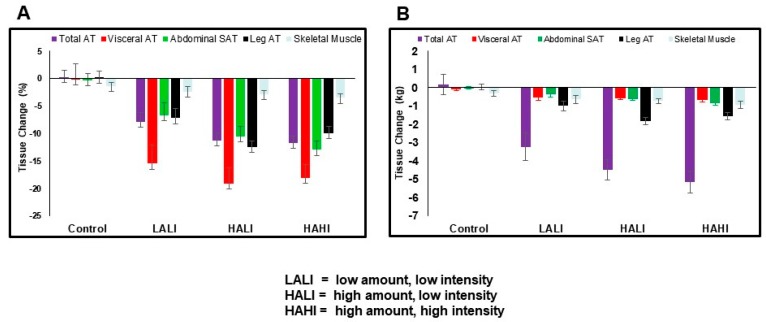
Figure 1.
Illustration of relative (%, Panel A) and absolute (kg, Panel B) response of adipose and skeletal muscle tissues to variations in exercise dose. Taken from Reference [14]. Used with permission from Obesity. Absolute (left) and relative (right) changes in AT and skeletal muscle depots. With the exception of skeletal muscle, all AT depot changes (absolute and relative) were significantly different from control (p < 0.008; both panels). Relative change in VAT was greater than all other AT and skeletal muscle depots (p < 0.01; right panel). AT, adipose tissue; HAHI, high amount, high intensity; HALI, high amount, low intensity; LALI, low amount, low intensity.

