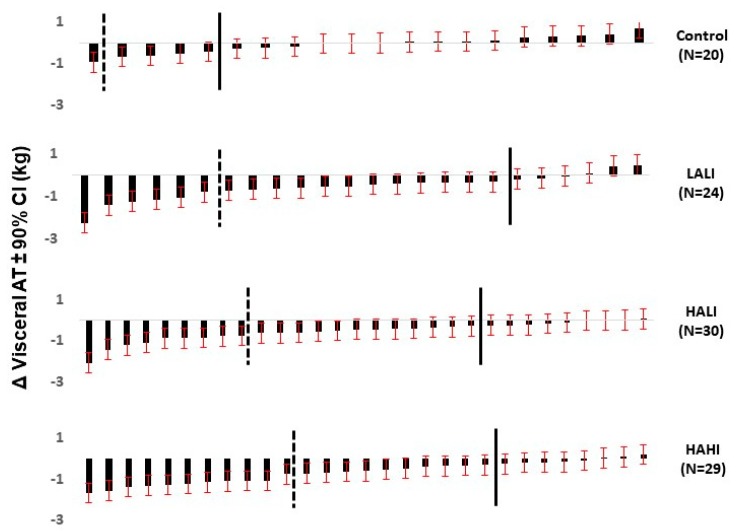
Figure 2.
Variability of visceral adipose tissue (VAT) response to standardized exercise. Taken from Reference [19]. Used with permission from MSSE. Distribution of individual responses for change in VAT (kg) ± 90% CI in the control and intervention groups. The solid black line distinguishes participants whose observed response exceeds the MCID (e.g., those participants to the left of the solid line reduced visceral AT by < 0.28 kg). The dashed black line distinguishes participants whose observed response ± 90% CI exceeds the MCID (e.g., those participants to the left of the dashed line have CI where the top range is < 0.28 kg). LALI (low amount (~30 min), low intensity (50% VO2 peak)), HALI (high amount (~60 min), low intensity (50% VO2 peak)), HAHI (High amount (~40 min), high intensity (75% VO2 peak)).

