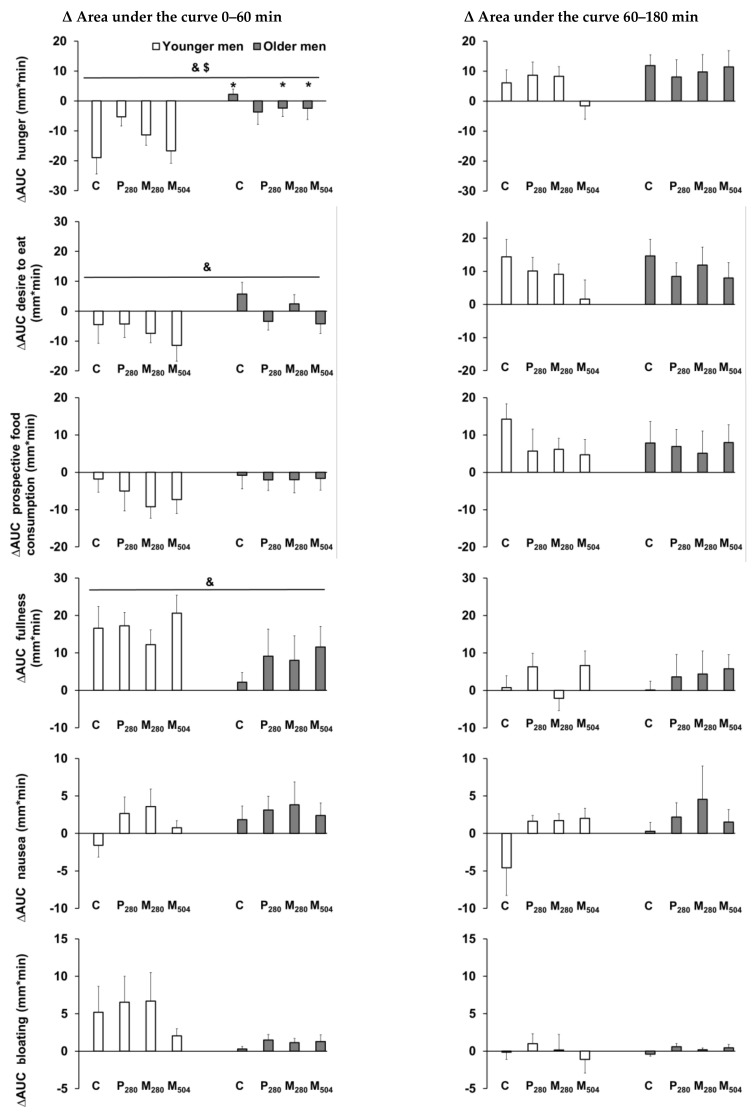
Figure 1.
Mean (± standard error of the mean (SEM)) change relative to baseline (after overnight fasting) in the area under the curve (∆AUC) of perceptions of hunger, desire to eat, prospective food consumption, fullness, nausea, and bloating (all mm/min, n = 13 healthy young men; n = 13 healthy older men) after consumption of (i) a control drink (450 mL, ~2 kcal) or iso-volumetric drinks containing protein/fat/carbohydrate: (ii) 70 g/0 g/0 g (280 kcal/‘P280′), (iii) 14 g/12.4 g/28 g (280 kcal/‘M280′), or (iv) 70 g/12.4 g/28 g (504 kcal/‘M504′). & p < 0.05 indicates the overall effect of age. $ p < 0.05 indicates the interaction effect of age by drink-condition. * p < 0.05 post hoc age by drink-condition interaction effect indicates the conditions for which there was a significant difference between older and younger men.

