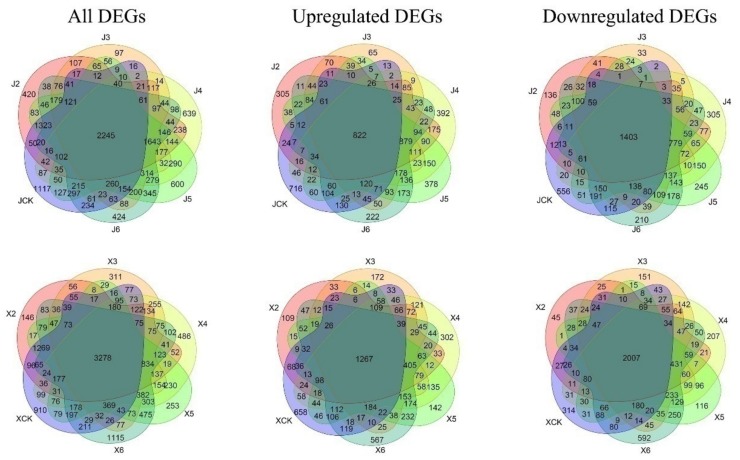
Figure 2.
Venn diagrams of differentially expressed genes (DEGs) in the two B. rapa accessions during different vernalization periods. J2, J3, J4, J5, J6, and JCK represent the number of DEGs obtained by comparing ‘JinWawa’ 0 days after treatment (DAT) with 25, 30, 35, 40, and 50 DAT, and 35 DAT 25 °C, respectively. X2, X3, X4, X5, X6, and XCK represent the number of DEGs obtained by comparing ‘Xiao Baojian’ 0 DAT with 10, 15, 25, 40, and 50 DAT and 25 DAT 25 °C, respectively. False discovery rate (FDR) < 0.01 and |log2FC| > 1 were used as cut-off criteria for significance.

