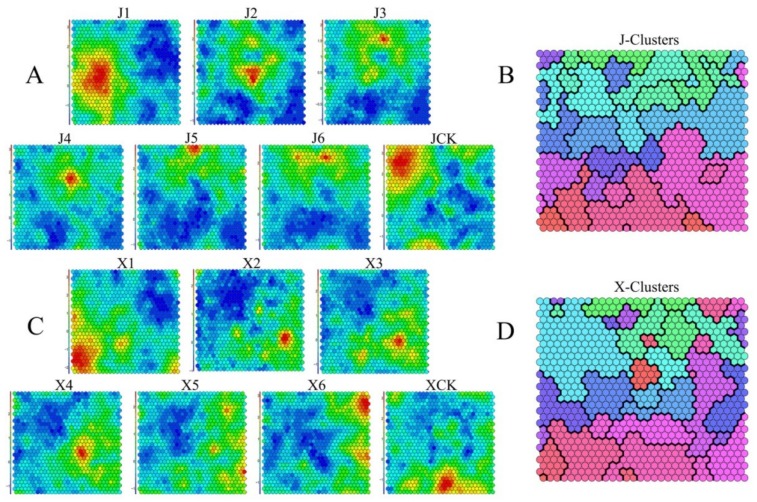
Figure 4.
The temporal expression patterns of 21,035 DEGs in ‘JWW’ during vernalization (A); self-organizing feature map (SOM) clustering identified 20 clusters in ‘JWW’, in which different colors represent separate clusters (B); the temporal expression patterns of 21,035 DEGs in ‘XBJ’ during vernalization (C); SOM clustering identified 20 clusters in ‘XBJ’, in which different colors represent separate clusters (D). The red to blue gradient indicated upregulation and downregulation, respectively (A,C).

