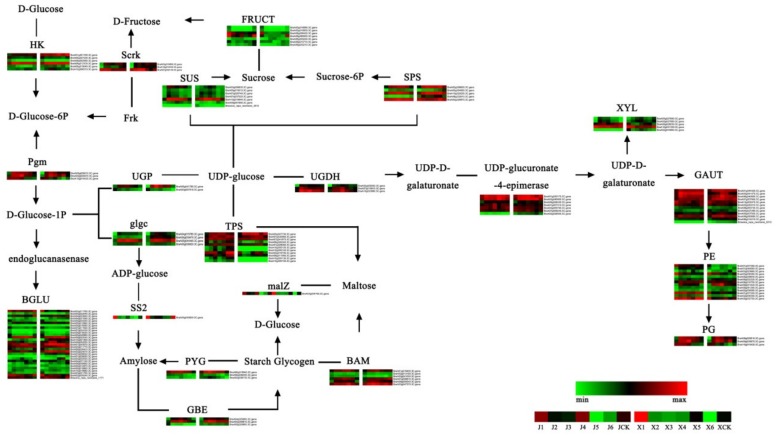
Figure 6.
Heat map of the starch and sucrose-related gene expression levels. Data were obtained using the log2FPKM of each gene. Red and green represent up- and downregulated genes, respectively. HK = histidine kinase; BGLU = beta-glucosidase; pgm = phosphoglucomutase; Scrk = fructokinase; SUS = sucrose synthase; UGP = UTP-glucose-1-phosphate uridylyltransferase; UDP = uridine diphosphate–glucose; UGDH = UDP-glucose 6-dehydrogenase; malZ = alpha-glucosidase; glgc = glucose-1-phosphate adenylyltransferase large subunit; SS2 = starch synthases 2; PYG = alpha-glucan phosphorylase; GBE = glucan-branching enzyme; Frk = fyn related Src family tyrosine kinase; BAM = maltose beta-amylase; XYL = beta-D-xylosidase; GAUT = beta-D-xylosidase; PE = pectinesterase/pectinesterase inhibitor; PG = phosphoglucomutase; TPS = trehalose-phosphate synthase; FRUCT = beta-fructofuranosidase; SPS = sucrose-phosphate synthase.

