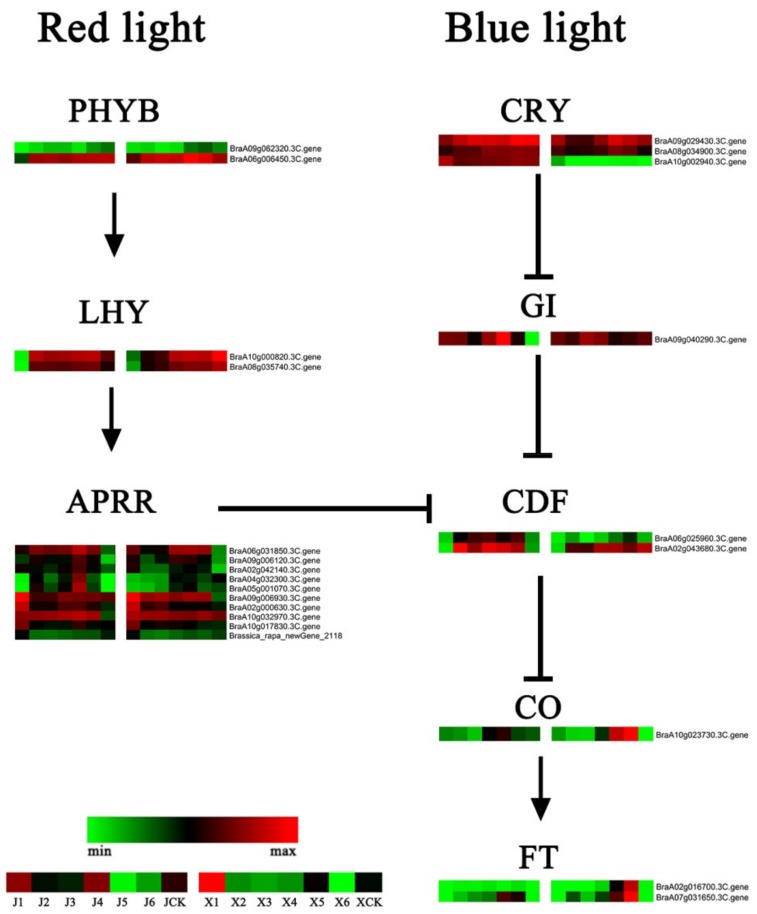
Figure 7.
Heat map of the photoperiod and circadian clock gene expression levels. Data were obtained using the log2FPKM of each gene. Red and green represent up- and downregulated genes, respectively. PHYB = phytochrome B; LHY = protein LHY; APRR = two-component response regulator; CRY = cryptochrome-2; GI = gigantea; CDF = cyclic dof factor; CO = constants; FT = floweing locus T.

