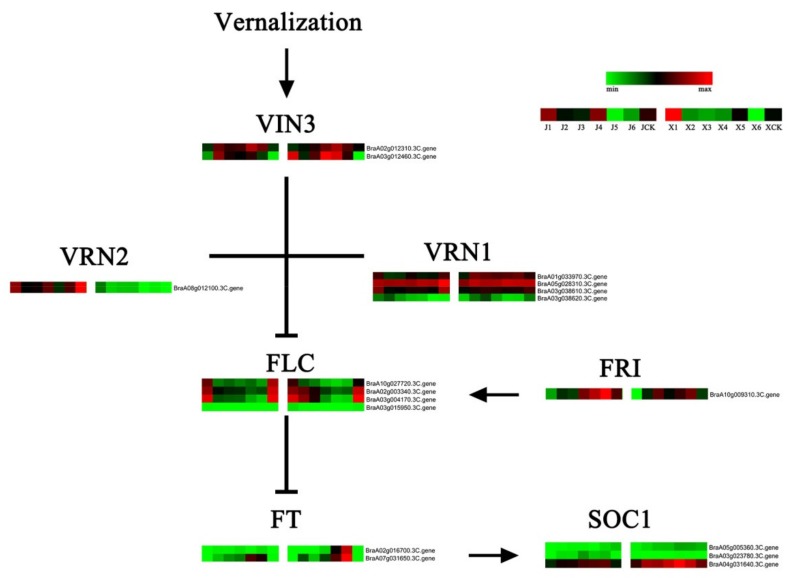
Figure 8.
Map of vernalization-related gene expression levels. Data were obtained using the log2FPKM of each gene. Red and green represent up- and downregulated genes, respectively. VIN3 = vernalization insensitive 3; VRN1 = B3 domain-containing transcription factor VRN1; VRN2 = B3 domain-containing transcription factor VRN2; FLC = flower locus C; FRI = frigida; SOC1 = suppressor of constans overexpression 1.

