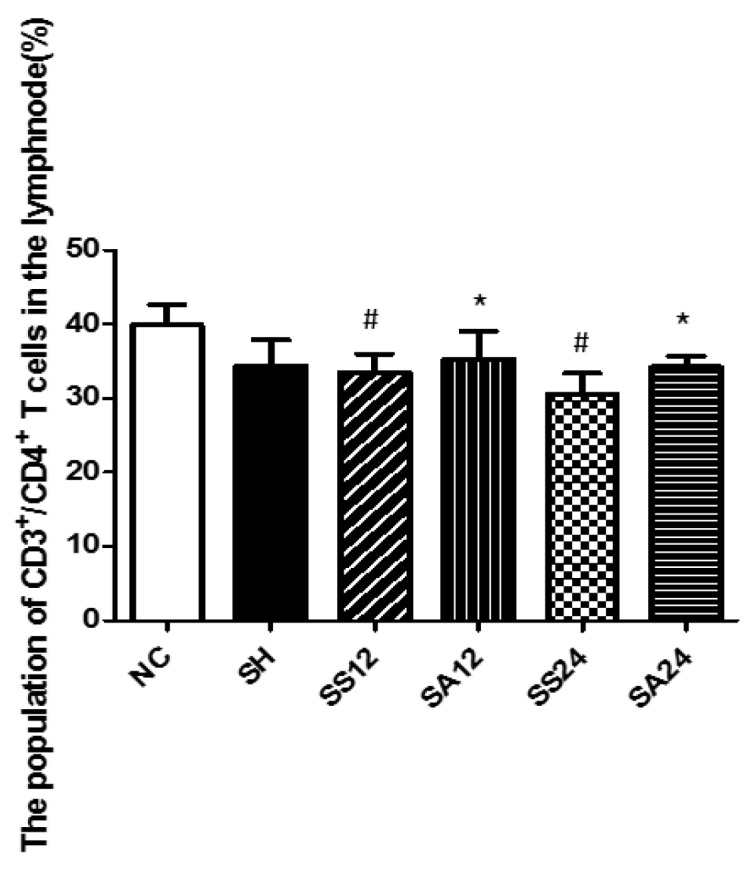
Figure 5.

Percentages of CD4+ T helper (Th) cells in para-aortic lymph nodes. The description of the groups are found in the legend of Figure 2. Data were analyzed using a one-way ANOVA with Tukey’s post hoc test and are presented as the mean ± SD. n = 8 for each group. # Significantly differs from the NC group (p < 0.05). * Significantly differs from the SS group at the same time point (p < 0.05).
