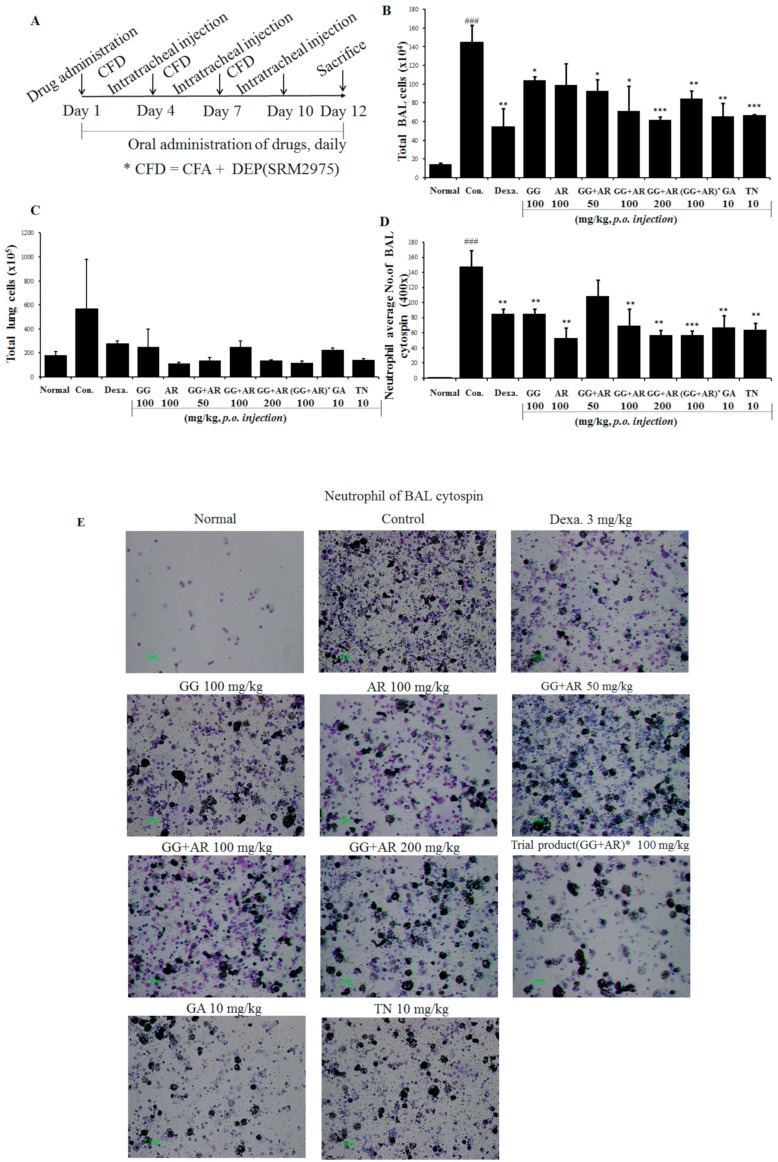
Figure 2.
Schematic diagram of CFD-induced chronic obstructive pulmonary disease (COPD) model mice (A). Total bronchoalveolar lavage (BAL) cell numbers of each treatment group (B). Total lung cell numbers of each treatment group (C). Neutrophil numbers in the BALF cytospin of each treatment group (D). Neutrophilic inflammation cytospin image (×400 images of cytospin slide) shown by differential leukocyte staining from BAL slides (E). Normal: normal group; Con.: CFD, CFD-induced COPD model group; Dexa.: CFD solution and administrated with dexamethasone 3 mg/kg group; GG 100: CFD solution and administrated with GG extract 100 mg/kg group; AR 100: CFD solution and administrated with AR extract 100 mg/kg group; GG + AR 50: CFD solution and administrated with GG plus AR extract 50 mg/kg group; GG+AR 100: CFD solution and administrated with GG plus AR extract 100 mg/kg group; GG+AR 200: CFD solution and administrated with GG plus AR extract 200 mg/kg group; GG+AR 100* (trial product): CFD solution and administrated with GG plus AR (trial product) 100 mg/kg group; GA 10: CFD solution and administrated with GA 10 mg/kg group; TN 10: CFD solution and administrated with TN 10 mg/kg group. The statistical significance of differences between control and treatment groups were assessed by ANOVA and Duncan’s multiple comparison test were applied using Prism v. 7.0 (GraphPad Inc., San Diego, CA). Data represent the mean ± SEM of 8 independent experiments. (### P < 0.001, significantly different from the value of normal group.* P < 0.05, ** P < 0.01 and *** P < 0.001 significantly different from the value of control group.).

