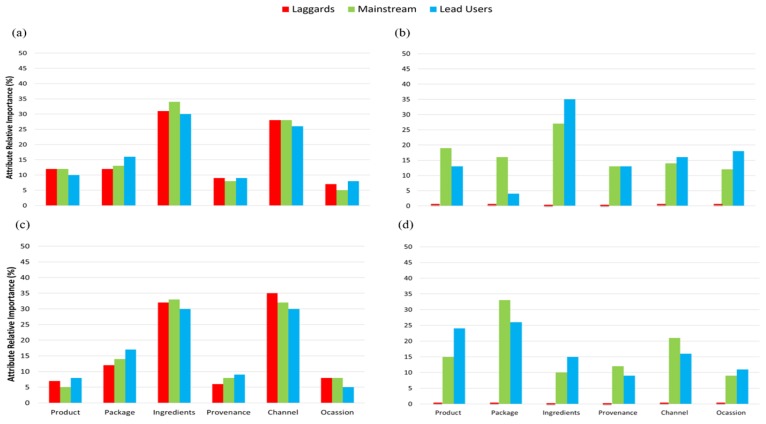
Figure 5.
Average of the regression coefficients across all levels for an attribute for the three groupings of consumers being laggards (last to adopt a product), mainstream (general public) and lead users (fist to adopt a product) across the six attributes (product, package, ingredients, provenance, channel and occasion) for (a) cheese Australia (n = 134, age=55–80), (b) cheese China (n = 31, age = 55–80), (c) chocolate Australia (n = 144, age = 55–90) and (d) chocolate China (n = 29, age = 55–67). Regression coefficients of levels within attributes, within age groups and country, are given for selected food categories in Table 5 (for cheese) and Table 6 (for chocolate).

