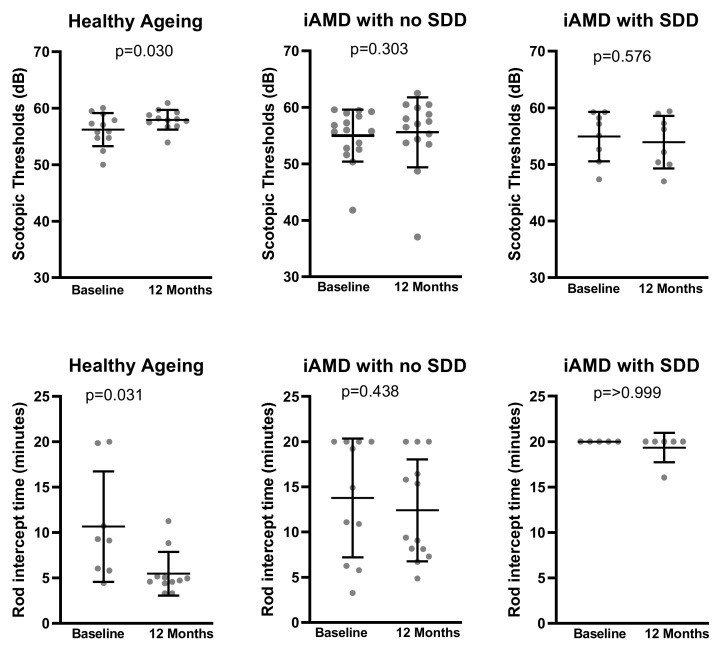
Figure 1.
Scatter plots showing change in scotopic thresholds and rod-intercept time (RIT) from baseline to 12 months for 670 nm trial participants. Error bars represent the mean with standard deviation. Only assessments with less than 33% fixation error are displayed in RIT plots. (iAMD = intermediate AMD; SDD = subretinal drusenoid deposits.

