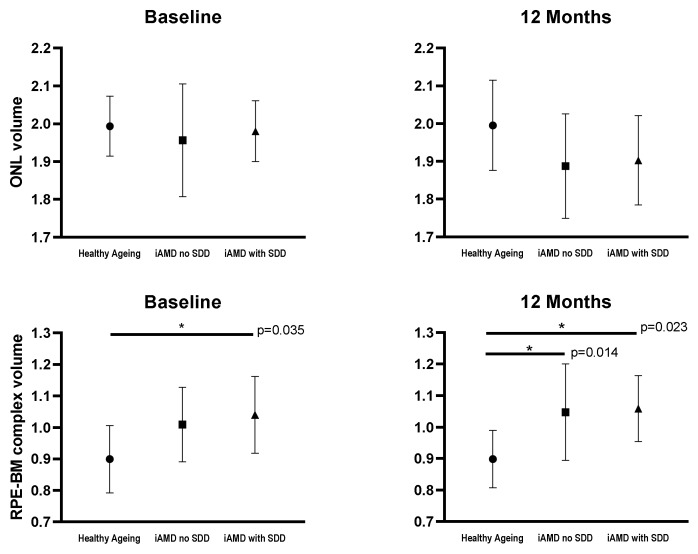
Figure 2.
Mean plots showing differences at baseline and 12 months in outer nuclear layer (ONL) and retinal pigment epithelium and Bruch’s membrane complex (RPE-BM) layer volumes between healthy ageing (n = 12), iAMD with no SDD (n = 16) and iAMD with SDD (n = 8) groups. Statistically significant differences are displayed on the plots. Error bars represent SD. iAMD = intermediate AMD; SDD = subretinal drusenoid deposits,

