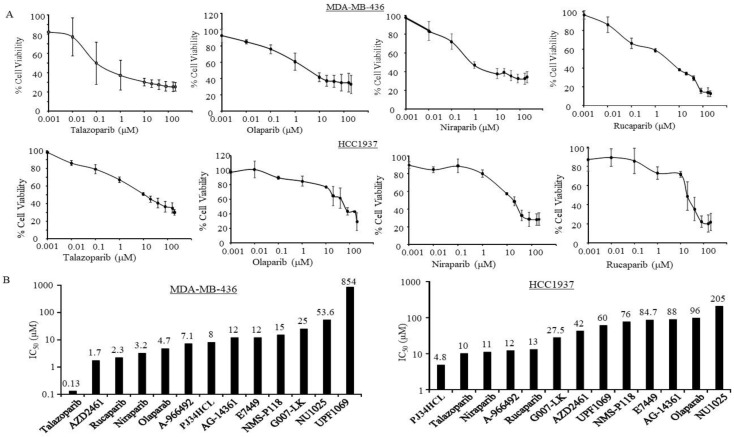
Figure 1.
BRCA1 (BRast CAncer 1 gene) mutant TNBC (triple negative breast cancer) cells in response to Poly (ADP-ribose) polymerase inhibitors (PARPi). MDA-MB-436 and HCC1937 cells were treated with PARPi from 0.001 to 200 µM for 7 days, then the cell viabilities and the half maximal inhibitory concentration (IC50) of the indicated PARPi were determined as described in the Methods Section. (A) Inhibition curves in the cells under the indicated PARPi treatments, the points are averaged from 3 independent assays; bars represent standerd errors (SE). (B) The bars indicate mean IC50 of the indicated PARPi estimated by using the semi logarithm-transformed dose-response data with a Linear Regression model. The number presented on top of the bars indicates the mean IC50 for the indicated PARPi.

