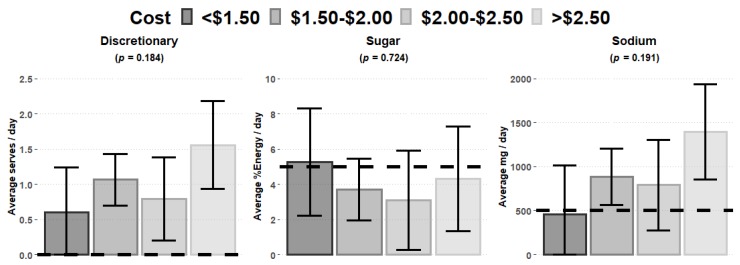
Figure 2.
Cost relationship with discretionary food, sugar, and sodium provision. Dotted line equals recommended serves for each core food group (50% ADG). Error bars represent the ±95% confidence interval. Sugar comparator is 50% of 10% of total energy [38]. Sodium comparator is 50% upper limit of Nutrient Reference Value for child aged 1–3 years (1000 mg/day) [35].

