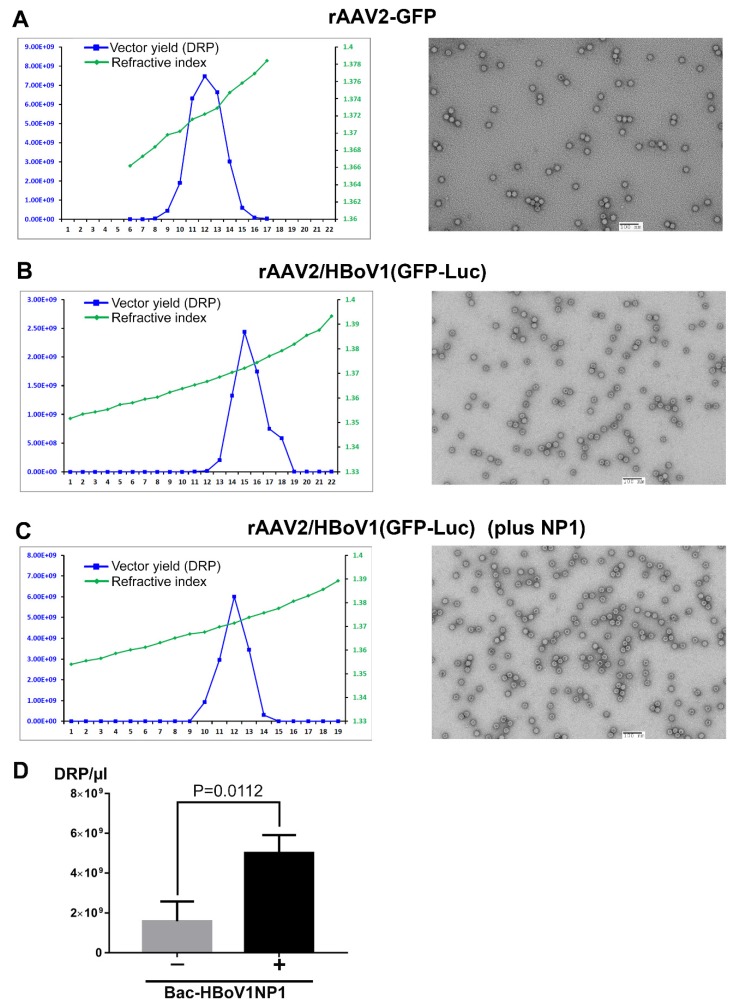
Figure 3.
Purification of rAAV2 and rAAV2/HBoV1 vectors produced from BEV-infected Sf9 cells. (A–C) Vector production. Sf9 cells were co-infected with Bac-AAV2ITR-GFP and Bac-AAV2Rep-Cap (A), Bac-AAV2ITR-GFP-Luc and Bac-AAV2Rep-HBoV1Cap (B), or Bac-AAV2ITR-GFP-Luc, Bac-AAV2Rep-HBoV1Cap, and Bac-HBoV1NP1 (C). Cell lysates from infected cells were fractionated by CsCl equilibrium ultracentrifugation. Left panel: qPCR analysis was used to determine the DRP in each fraction of 0.5 mL (blue line); the density of each fraction was determined as refractive index and is shown by the line in green. Right panel: transmission electron micrographs of rAAV2 or rAAV2/HBoV1 vectors, which were negatively stained with a 1% uranyl acetate solution. Bar = 100 nm. (D) Comparison of rAAV2/HBoV1 production with or without NP1 expression in Sf9 cells. The experiments in panels B&C were repeated three times in parallel. Purified vectors at the peak fraction were quantified and compared. Averages and standard deviations are shown. Statistical analysis was performed to get the P value using student “t” test.

