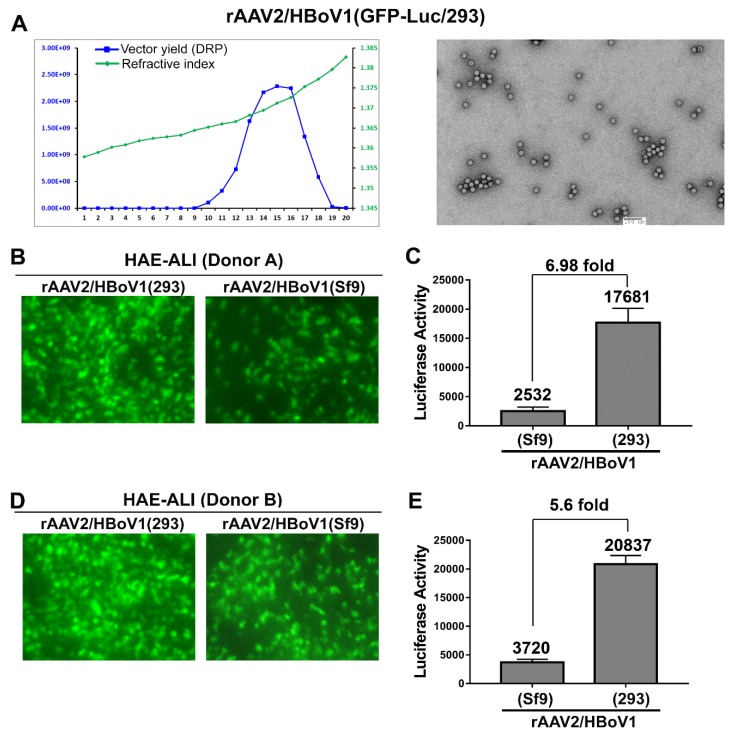
Figure 4.
Comparison of the transduction efficiency between the rAAV2/HBoV1 vectors produced in Sf9 cells and HEK293 cells. (A) rAAV2/HBoV1 vector produced from HEK293 cells. HEK293 cells were transfected with pAAV2ITR-GFP-Luc, pCMVNS*Cap-P5Rep, and pHelper. Cell lysates from infected cells were fractionated by CsCl equilibrium ultracentrifugation. Left panel: qPCR analysis was used to determine the DRP in each fraction (blue line); the density of each fraction was determined as refractive index using an Abbe refractometer and is shown by the line in green. Right panel: a transmission electron micrograph of rAAV2/HBoV1(293) vectors. (B–E) rAAV2/HBoV1 transduction of HAE-ALI. HAE-ALI cultures prepared form Donor A (B,C) and Donor B (D,E) were transduced with rAAV2/HBoV1 either produced from Sf9 or HEK293 cells at an MOI of ~2000 DRP/cell from the apical surface. The rAAV2/HBoV1 vector was applied directly onto the apical surface of the airway epithelia. HAE cells were examined for GFP expression at 10 days post-transduction. Images were taken with an Eclipse Ti-S microscope (Nikon, Melville, NY, USA) at a magnification of × 20 (B&D). Luciferase activity was assayed at 10 days post-transduction (C&E). Averages and standard deviations generated from at least three independent experiments are shown. Statistical analysis was performed to get the P value using student “t” test.

