Figure 3.
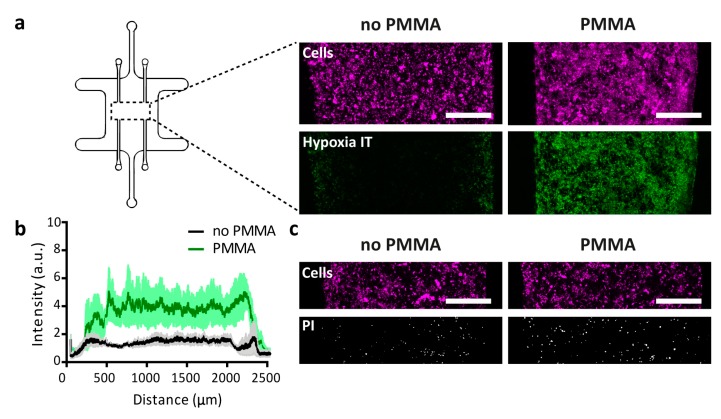
Evaluation of the generation of hypoxia in the microfluidic device. (a) 3D tumor cultures of collagen and U-251 MG cells were loaded in devices with or without embedded PMMA sheets, and incubated with the oxygen-sensitive dye ImageIT (green). U-251 MG cells were stained with CytoTell Red (depicted in magenta here). The scale bars represent 500 μm. (b) Quantification of the intensity of ImageIT for devices as described in panel a. Lines depict averages at distinct positions in the devices and the shaded areas indicate the standard error of the mean (s.e.m.), n = 3. (c) Pictures showing similar cell densities of U-251 MG cells (Cytotell Red, magenta) and comparable numbers of PI-positive cells (white) in devices with or without the PMMA sheet. The scale bars represent 500 μm.

