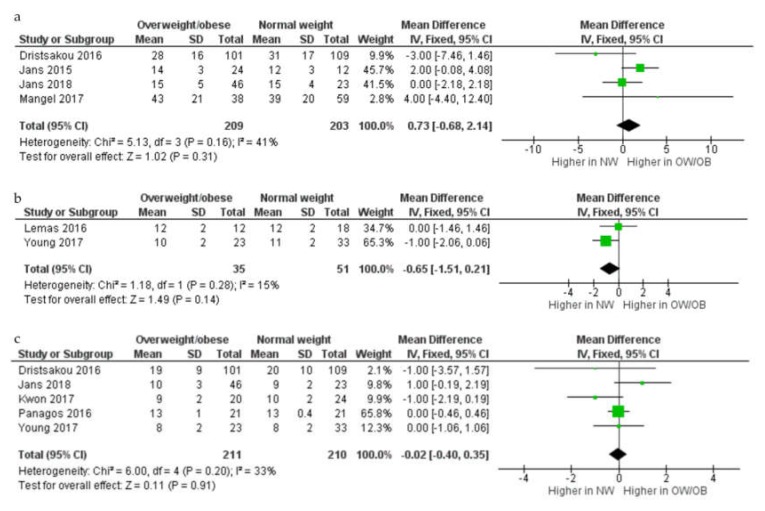
Figure 3.
Comparison of protein concentration (g/L) from normal weight and overweight and obese women according to stage of lactation, colostrum (a), transitional (b), and mature (c). CI, confidence interval; Chi2 and I2, measures of heterogeneity; IV, inverse variance; NW, normal weight women; OB, obese women; OW, overweight women; SD, standard deviation.

