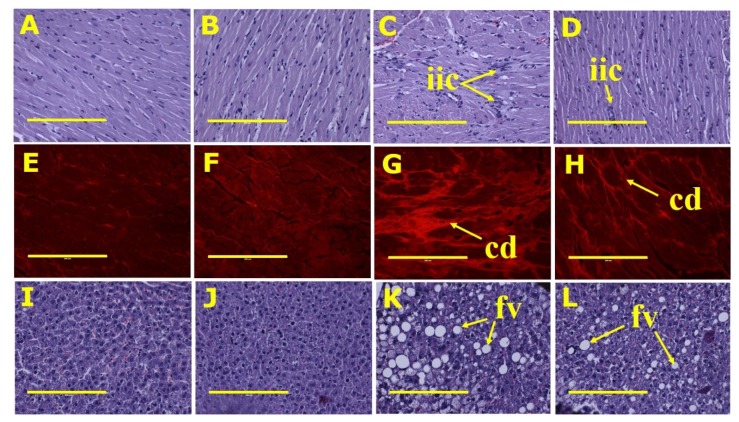
Figure 3.
Heart histology: infiltrated inflammatory cells (top row—“iic”) using haematoxylin and eosin stain; collagen deposition (middle row—“cd”) using picrosirius red stain. Liver histology: fat vacuoles (bottom row—“fv”) using haematoxylin and eosin stain in corn starch diet-fed rats (A,E,I); corn starch diet-fed rats supplemented with Saskatoon berry powder (B,F,J); high-carbohydrate, high-fat diet-fed rats (C,G,K); and high-carbohydrate, high-fat diet-fed rats supplemented with Saskatoon berry powder (D,H,L). The yellow scale bar is 200 µm (20×).

