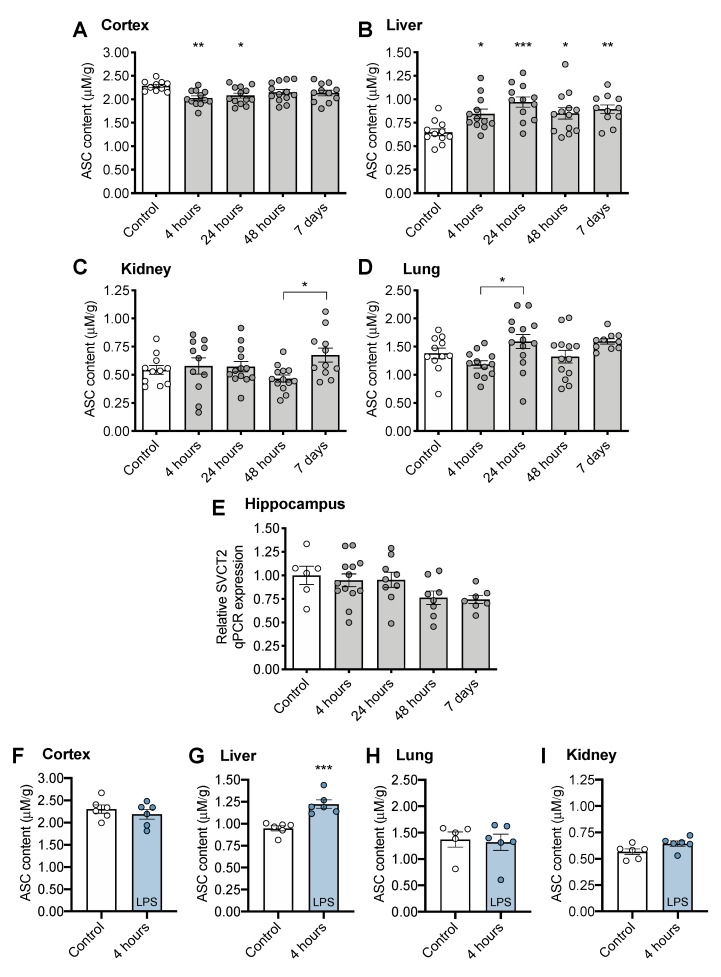
Figure 2.
Tissue ASC (ascorbate) concentrations following CS treatment in (A) cortex, (B) liver, (C) kidney, (D) lung. (E) Sodium-dependent vitamin C transporter 2, SVCT2 gene expression in brain following CS treatment. Tissue ASC concentrations following LPS treatment (F) brain, (G) liver, (H) lung, and (I) kidney. * p < 0.05 ** p < 0.01 *** p < 0.001 from control following significant ANOVA results unless otherwise indicated. Error bars plotted as mean ± SEM.

