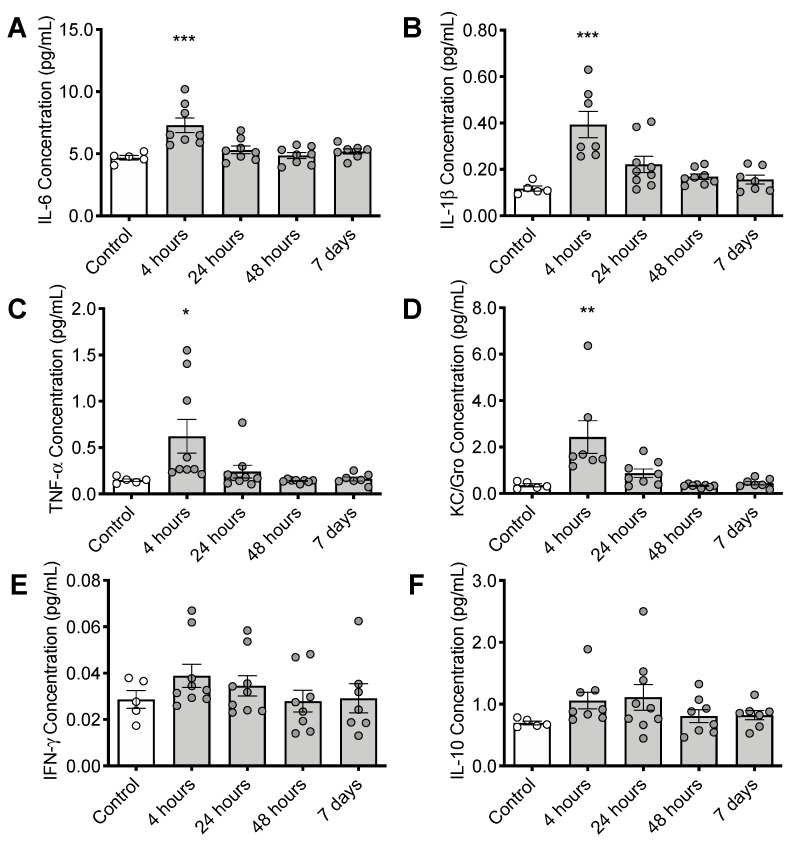
Figure 4.
Timeline of inflammatory changes in the brain following CS treatment. Cortical cytokine levels of (A) interleukin 6 (IL-6), (B) interleukin 1β (IL-1β), (C) tumor necrosis factor alpha (TNFα), and (D) chemokine (C-X-C motif) ligand 1 (CXCL1, KC/Gro), (E) Interferon gamma (INFγ) and (F) interleukin 10 (IL-10) * p < 0.05, ** p < 0.01, *** p < 0.001. Error bars plotted as mean ± SEM.

