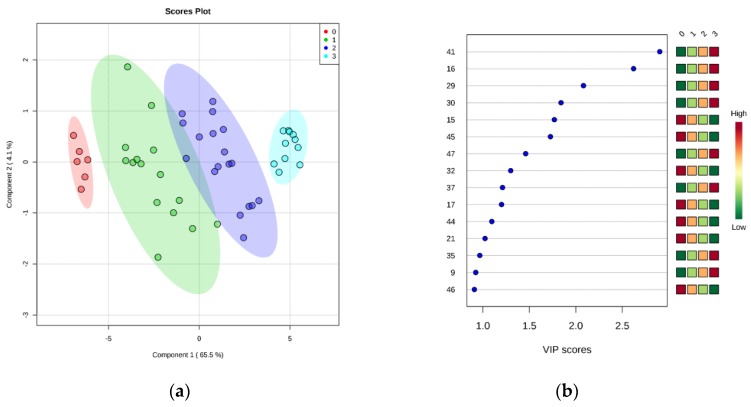
Figure 4.
(a) Partial least squares discriminant analysis (PLS-DA) scores plotted for freshness grades of sea bream stored on ice. The legend indicates the four EU grades: Extra (0), A (1), B (2), unacceptable (3). (b) Top 15 metabolite features based on variable importance in projection (VIP) scores from PLS-DA. The x-axis shows the scores whereas the y-axis corresponds to GC–MS peak number from peak index (see Table 1). Color bars show median intensity of metabolite feature in the respective group.

