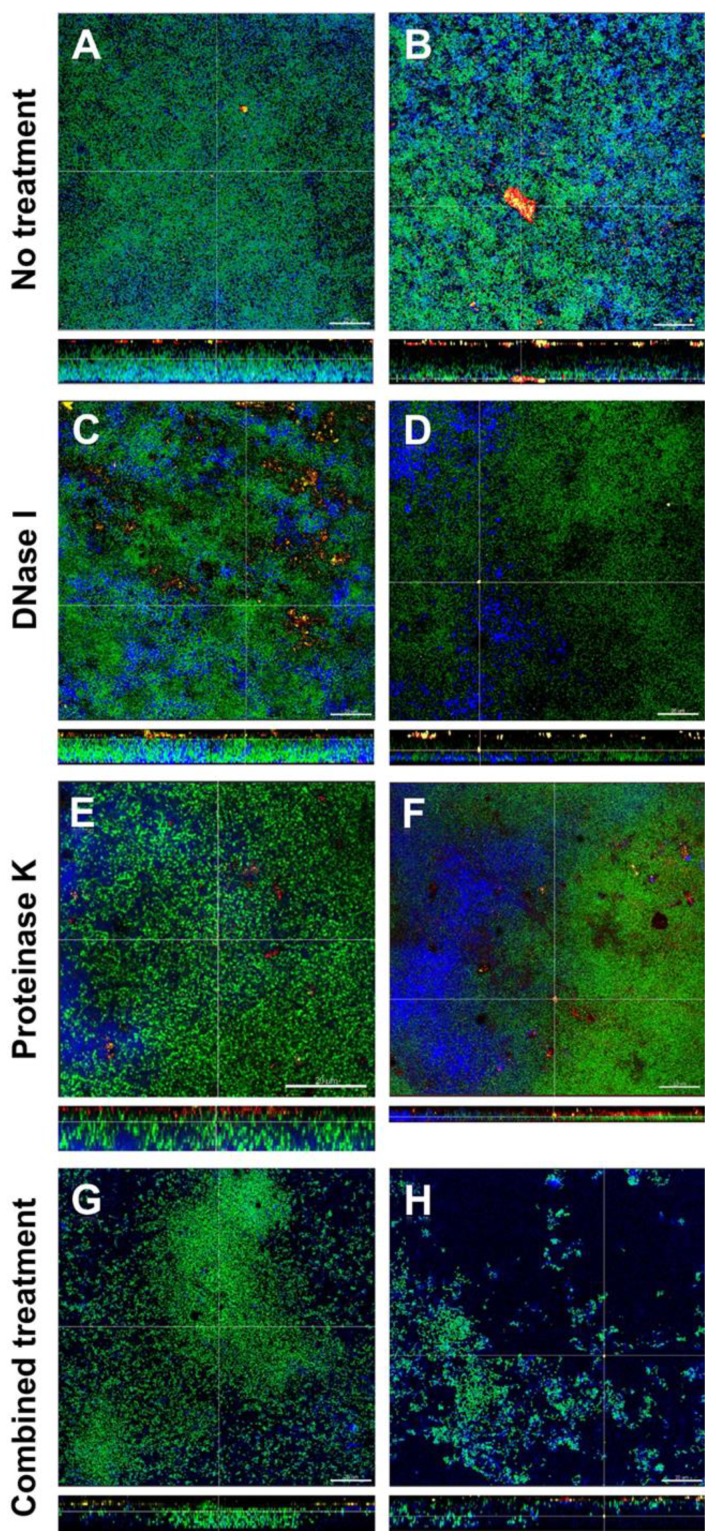
Figure 3.
Representative confocal laser scanning microscopy (CLSM) images of six-species oral biofilms after no treatment (A,B), or exposure to 0.001 mg/mL DNase I (C), 0.002 mg/mL DNase I (D), 0.05 mg/mL proteinase K (E), 0.1 mg/mL proteinase K 0.1 mg/mL (F), or combined treatment with 0.001 mg/mL DNase I and 0.05 mg/mL proteinase K (G), or with 0.002 mg/mL DNase I and 0.1 mg/mL proteinase K (H), respectively. Bacteria appear green due to DNA-staining with Yo Pro 1/Sytox Green; extracellular polysaccharides are stained blue with calcofluor; extracellular DNA appear red after staining with anti-DNA antibodies and streptavidin (Cy3); extracellular proteins appear yellow due to SyproTM Ruby. The biofilm base in the cross sections is directed towards the top view. Scale = 20 µm.

