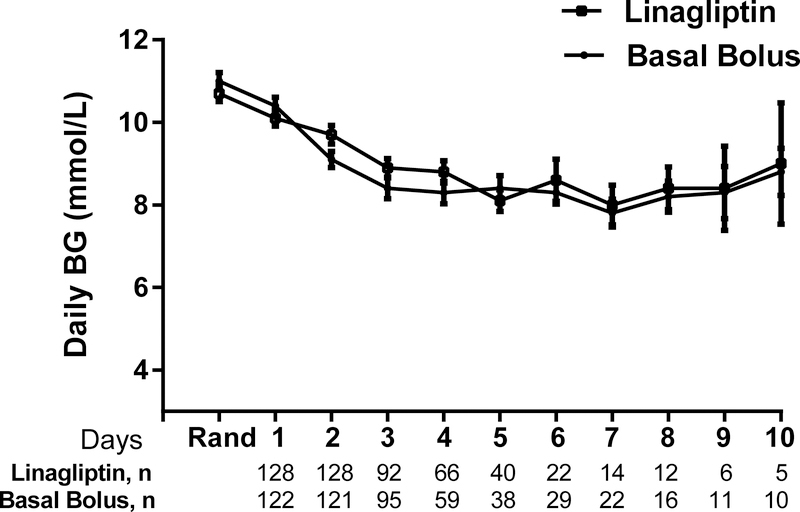
Figure 3:
Mean BG Levels During Days on Study between Linagliptin and Basal Bolus Insulin Regimens. There were no differences in glucose levels on most days during the study between the linagliptin (open squares) and the basal bolus insulin regimen (closed circles) except on Day 3 of the study (p=0.03). Data are expressed as mean ± SEM. Abbreviations: BG, Blood Glucose

